ZoneLens - Order Blocks, Fair Value Gaps and Market Structure
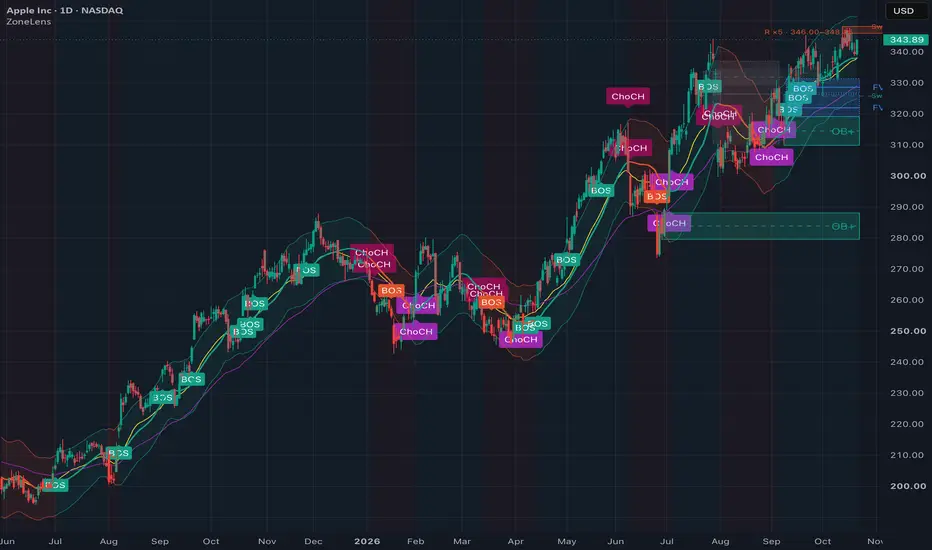
ZoneLens shows on one chart where price turned before and which way the trend points. It combines four parts, each answering one question:
How the parts work together
The structure labels decide where zones come from: every order block is created by a visible BOS or ChoCH. The trend channel decides which side matters: in an uptrend you watch OB+ and FVG+ below price, in a downtrend OB− and FVG− above it. Zones disappear at their first touch, so the chart only shows levels that price has not tested yet.
Why ZoneLens
Reading the chart
A typical workflow
How it works
Alerts (16)
Touch alerts fire once per zone, on the first bar that reaches the zone or comes within "Touch alert distance": OB+ touched, OB− touched, FVG+ touched, FVG− touched, OB+ or FVG+ touched, OB− or FVG− touched, OB+ higher timeframe touched, OB− higher timeframe touched, OB+ FVG touched, OB− FVG touched (flipped zones). Structure alerts: BOS+, BOS−, CHoCH+, CHoCH−, BOS+ or CHoCH+, BOS− or CHoCH−. In the default Signal Mode "Confirmed only", all alerts are checked on bar close.
Values for other scripts
Six values appear in the Data Window and can be selected as a "Source" in other indicators and strategies, for example as an external signal in a strategy or alert builder:
The values are final at the bar's close; on the open bar they follow price, like the alerts.
Settings worth knowing
Limitations
License
Open source under the Mozilla Public License 2.0. All code in this script is the author's own.
- Order blocks (OB+ / OB−): where did the move that broke market structure start?
- Fair value gaps (FVG+ / FVG−): which price gaps did fast moves leave behind?
- BOS and ChoCH labels: does the structure continue, or does it change character?
- Keltner trend channel and two EMAs (21 and 55): which way does the trend point on your timeframe, and how strong is the momentum?
How the parts work together
The structure labels decide where zones come from: every order block is created by a visible BOS or ChoCH. The trend channel decides which side matters: in an uptrend you watch OB+ and FVG+ below price, in a downtrend OB− and FVG− above it. Zones disappear at their first touch, so the chart only shows levels that price has not tested yet.
Why ZoneLens
- Every order block belongs to a visible BOS or ChoCH label, so you always know which break created a zone.
- Clean chart: a zone disappears after price touches it for the first time.
- Flipped zones: if price breaks a zone and leaves a gap, the zone turns into a zone of the opposite direction, labelled "OB+ FVG" or "OB− FVG". They usually stay much longer.
- Higher-timeframe zones: optionally the two newest untouched order blocks per side of a higher timeframe, for example daily zones on a 1-hour chart. They use the values of the last closed bar of that timeframe and do not repaint.
- Every open gap shows a quality score Q.
- Alerts when price touches a zone, optionally shortly before it, and for BOS or ChoCH, also combined (BOS or ChoCH).
- Values for other scripts: zone, touch, structure and trend states can be read by other indicators and strategies.
Reading the chart
- Petrol = bullish (OB+, uptrend), terracotta = bearish (OB−, downtrend)
- Blue box = FVG+, amber box = FVG−
- Solid border = order block, dashed border = flipped zone, dotted border = fair value gap, thick border = higher-timeframe zone (label e.g. "OB+ 1D")
- Grey = broken zone or filled gap
- The line inside a gap marks the level at which it counts as filled (60%)
- Bands "R ×n" / "S ×n" = a level tested n times from one side; dashed lines = current swing high and low
A typical workflow
- Check the channel colour for the trend direction.
- Look for a fresh BOS or ChoCH in that direction as confirmation.
- Watch the nearest untouched OB or FVG in trend direction as an area of interest for a pullback. Higher-timeframe zones mark the bigger levels.
- Set an "OB+ touched" or "OB− touched" alert instead of watching the chart.
- Treat a ChoCH against the channel colour as an early warning, not as a reversal call.
- Decide entries, stops and targets with your own method.
How it works
- Order blocks: at each BOS or ChoCH, the last candle in the opposite direction within the 10 bars before the break becomes the zone (its high to low, or only its body). Zones smaller than 0.2 × ATR(50) or larger than 3 × ATR(50) are skipped. A zone is broken when a bar closes beyond its far edge.
- Flip: if the breaking bar leaves a gap of at least the FVG minimum size, the zone becomes a zone of the opposite direction at the same price range, unless it overlaps an existing zone on that side.
- Fair value gaps: three-bar gaps of at least 0.5 × ATR(50). A gap counts as filled once 60% of it has been retraced. Q (0–100%) rises with the size of the gap, falls as the gap fills and adds 10 points when volume data is available.
- Market structure: swing highs and lows from pivots (5 bars left, 3 bars right). A close beyond the last swing in the direction of the structure is a BOS, a close against it is a ChoCH. By default a ChoCH is shown on the first break and again on the next bar if it confirms ("Ping+Verify").
- Trend channel: SMA(20) of the typical price ± 2 × ATR(20). The trend turns up on a close above the upper band and down on a close below the lower band, and it stays until the opposite band is crossed.
- Higher-timeframe zones use the same rules on that timeframe's own bars and take the values of its last closed bar.
- Repeated tests: a band where at least 3 highs (or lows) within ±0.2 × ATR(50) of one level were rejected, each test separated by a close at least 0.5 × ATR(50) away, and no high above (low below) the band since the first test. Searched over the last 100 bars.
- Swing levels: the current swing high and low used for BOS and ChoCH; the label names the event a break would give.
Alerts (16)
Touch alerts fire once per zone, on the first bar that reaches the zone or comes within "Touch alert distance": OB+ touched, OB− touched, FVG+ touched, FVG− touched, OB+ or FVG+ touched, OB− or FVG− touched, OB+ higher timeframe touched, OB− higher timeframe touched, OB+ FVG touched, OB− FVG touched (flipped zones). Structure alerts: BOS+, BOS−, CHoCH+, CHoCH−, BOS+ or CHoCH+, BOS− or CHoCH−. In the default Signal Mode "Confirmed only", all alerts are checked on bar close.
Values for other scripts
Six values appear in the Data Window and can be selected as a "Source" in other indicators and strategies, for example as an external signal in a strategy or alert builder:
- Export: long zone = 2 inside an active OB+, 1 inside an open FVG+, otherwise 0
- Export: short zone = −2 inside an active OB−, −1 inside an open FVG−, otherwise 0
- Export: long first touch = 2 on the bar of "OB+ touched", 1 on the bar of "FVG+ touched"
- Export: short first touch = −2 for "OB− touched", −1 for "FVG− touched"
- Export: structure = 1 after a break of the swing high, −1 after a break of the swing low, 0 before the first break
- Export: trend channel = 1 up, −1 down, 0 before the first close outside the channel
The values are final at the bar's close; on the open bar they follow price, like the alerts.
Settings worth knowing
- Hide after first touch (on): switch off to keep touched zones visible.
- Zones from higher timeframe (empty = off): e.g. 1 day on intraday charts, 1 week on daily charts.
- Touch alert distance × ATR(50) (0): e.g. 0.25 for an alert shortly before price reaches the zone.
- Zones shown per side and Gaps shown per side (2 each).
- Render visible range only (on): keeps the script fast. Switch off to see older zones.
- Signal Mode: "Confirmed only" uses closed bars (default). "Aggressive live" also reacts within the forming bar, and those zones can change until the bar closes.
- Every layer can be switched off in the Display group, and all colours can be changed.
Limitations
- No entry, stop or target logic, no backtest and no performance promise. Use the zones as context.
- Swing points need 3 bars on their right, so labels and zones appear with a short delay by design.
- Higher-timeframe zones update only when a bar of that timeframe closes.
- Repeated-test bands and swing lines are display only and have not been tested as a trading rule.
License
Open source under the Mozilla Public License 2.0. All code in this script is the author's own.

คำจำกัดสิทธิ์ความรับผิดชอบ
ข้อมูลและบทความไม่ได้มีวัตถุประสงค์เพื่อก่อให้เกิดกิจกรรมทางการเงิน, การลงทุน, การซื้อขาย, ข้อเสนอแนะ หรือคำแนะนำประเภทอื่น ๆ ที่ให้หรือรับรองโดย TradingView อ่านเพิ่มเติมใน ข้อกำหนดการใช้งาน
คำจำกัดสิทธิ์ความรับผิดชอบ
ข้อมูลและบทความไม่ได้มีวัตถุประสงค์เพื่อก่อให้เกิดกิจกรรมทางการเงิน, การลงทุน, การซื้อขาย, ข้อเสนอแนะ หรือคำแนะนำประเภทอื่น ๆ ที่ให้หรือรับรองโดย TradingView อ่านเพิ่มเติมใน ข้อกำหนดการใช้งาน