ที่อัปเดต:
Break quality: level breaks read against candle structure
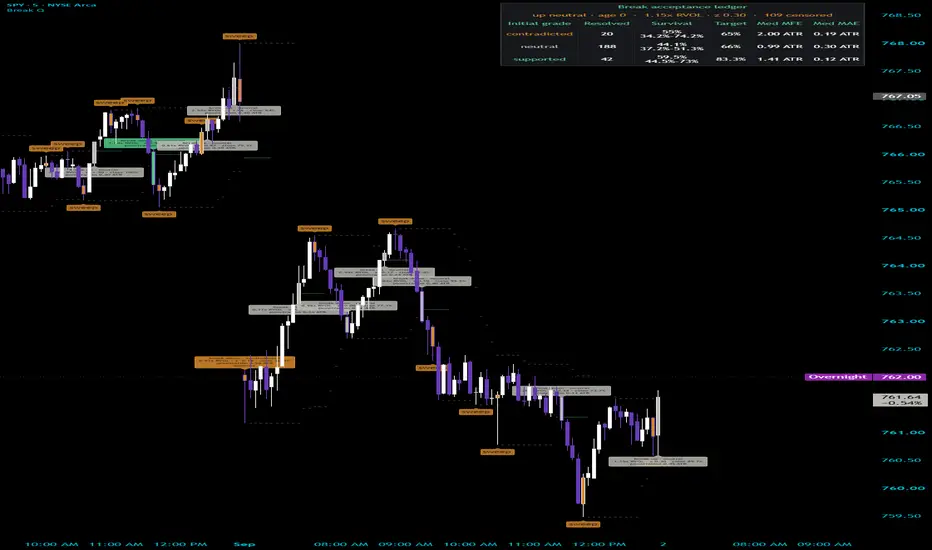
Two bars can close in exactly the same place after taking out a recent high. One is buyers absorbing supply. The other is a trap. This reads the bar that did the breaking to tell them apart.
What it does
It watches the highest high and lowest low of the last few bars. When price closes beyond one of them, that is a break, and the script then asks two questions about the bar that produced it: did enough volume show up, and did the bar's own shape agree with the direction it just moved.
A break on strong volume with nothing contradicting it is marked as supported. A break on thin volume is marked as unconfirmed. A break where the same bar printed a reversal pattern pointing the other way is marked as contradicted, in its own colour, because that is the case worth stopping on.
Why these things are in one script
This is not a breakout tool and a pattern scanner merged for convenience. They were two separate scripts and the reason for combining them is that neither answers the question on its own.
A break is a liquidity event. Price trades through a level where resting orders sat, those orders get filled, and the close tells you the level was crossed. It does not tell you who did the crossing or whether they intend to stay. Continuation and a stop run produce the same closing price.
What separates them is visible on the breaking bar itself. Continuation looks like a decisive body with participation behind it. A trap looks like a long rejection wick, or an engulfing bar in the opposite direction, printed on volume that never arrived. That evidence exists for exactly one bar, at exactly one location, and scanning for it independently across the whole chart produces hundreds of marks that have nothing to do with any level.
So the candle structure here is subordinate to the break. It is not reported unless a level was taken. That subordination is the entire design, and it is why this is one script and not two.
There is also a plain engineering reason. Both halves needed relative volume against the same average, and as separate indicators that average was computed twice from identical data on every bar. Here it is computed once and both readings share it.
How it works
The level is the highest high or lowest low of the prior bars, deliberately excluding the current one. Including it would let the level move with the bar trying to break it, and nothing could ever exceed it.
A break is a close beyond that level. In a trending market a new high is set on almost every bar, so only the first break of a run is treated as an event, and a spacing setting stops a strong trend from covering the chart in labels. Bar colouring stays continuous through the run, so you still see the whole move.
Volume is compared to its own moving average. At or above the strong threshold the break is treated as participated; below one times average it is treated as thin.
The candle structure read covers engulfing, hammer and shooting star, piercing and dark cloud, harami, and harami cross. Each family has its own toggle. A shape pointing against the break direction is what triggers the contradicted reading. The doji used by the harami cross is defined by a body no larger than a set fraction of the bar's range, and that fraction is a setting rather than a hidden constant.
The broken level is drawn forward as a dashed line and removed when price trades back to it, because a level that has been revisited has stopped being a reference.
Everything confirms on bar close by default.
How to use it
Works on any symbol and timeframe that reports volume.
The reading to act on is not the break itself but the label under it. Supported, unconfirmed and contradicted are three different situations that look identical if you only watch price close beyond a line.
Contradicted breaks are the reason the script exists. A break that prints a reversal shape on its own bar is not automatically a fade, but it is a break that has not yet proven anything, and treating it identically to a supported one is how breakout traders get taken apart.
Raise the lookback for fewer and more significant levels. Raise the spacing setting if a trending instrument is still producing too many marks. Turn the structure read off entirely and it becomes a plain break-and-volume tool with nothing else changed.
What it cannot do
A contradicted break is a description of one bar, not a forecast. Some traps reverse immediately and some run for days before they do. The label says the evidence on that bar conflicts, and nothing more.
Candlestick patterns are shape definitions with no universally agreed thresholds. The definitions used here are listed above so you can check them against your own rather than trust mine. Piercing and dark cloud are implemented in the strict form requiring a genuine gap beyond the prior bar's extreme, which means they fire rarely on intraday charts where gaps are uncommon.
The level is a recent high or low and nothing more. It carries no weight from prior sessions, no volume profile, no higher timeframe context. A five-bar high on a quiet afternoon and a five-bar high at a weekly extreme are treated identically.
There are no entries, exits, targets or stops in this script, and no performance of any kind is claimed, measured or implied.
On authorship
Swing breakouts, relative volume and the classic candlestick reversal patterns are all public methodology and I have said so plainly. The implementation is not borrowed. Every line is written from scratch and no code in it is copied or adapted from another author's script, on this platform or anywhere else.
Settings
Lookback for the level, confirm-on-close and minimum spacing between marked breaks; volume average length and the strong-participation multiple; a master switch for the structure read plus a toggle per pattern family and the doji body fraction; and display options for the level lines, labels, plotted levels, bar colouring, label size and colours.
What it does
It watches the highest high and lowest low of the last few bars. When price closes beyond one of them, that is a break, and the script then asks two questions about the bar that produced it: did enough volume show up, and did the bar's own shape agree with the direction it just moved.
A break on strong volume with nothing contradicting it is marked as supported. A break on thin volume is marked as unconfirmed. A break where the same bar printed a reversal pattern pointing the other way is marked as contradicted, in its own colour, because that is the case worth stopping on.
Why these things are in one script
This is not a breakout tool and a pattern scanner merged for convenience. They were two separate scripts and the reason for combining them is that neither answers the question on its own.
A break is a liquidity event. Price trades through a level where resting orders sat, those orders get filled, and the close tells you the level was crossed. It does not tell you who did the crossing or whether they intend to stay. Continuation and a stop run produce the same closing price.
What separates them is visible on the breaking bar itself. Continuation looks like a decisive body with participation behind it. A trap looks like a long rejection wick, or an engulfing bar in the opposite direction, printed on volume that never arrived. That evidence exists for exactly one bar, at exactly one location, and scanning for it independently across the whole chart produces hundreds of marks that have nothing to do with any level.
So the candle structure here is subordinate to the break. It is not reported unless a level was taken. That subordination is the entire design, and it is why this is one script and not two.
There is also a plain engineering reason. Both halves needed relative volume against the same average, and as separate indicators that average was computed twice from identical data on every bar. Here it is computed once and both readings share it.
How it works
The level is the highest high or lowest low of the prior bars, deliberately excluding the current one. Including it would let the level move with the bar trying to break it, and nothing could ever exceed it.
A break is a close beyond that level. In a trending market a new high is set on almost every bar, so only the first break of a run is treated as an event, and a spacing setting stops a strong trend from covering the chart in labels. Bar colouring stays continuous through the run, so you still see the whole move.
Volume is compared to its own moving average. At or above the strong threshold the break is treated as participated; below one times average it is treated as thin.
The candle structure read covers engulfing, hammer and shooting star, piercing and dark cloud, harami, and harami cross. Each family has its own toggle. A shape pointing against the break direction is what triggers the contradicted reading. The doji used by the harami cross is defined by a body no larger than a set fraction of the bar's range, and that fraction is a setting rather than a hidden constant.
The broken level is drawn forward as a dashed line and removed when price trades back to it, because a level that has been revisited has stopped being a reference.
Everything confirms on bar close by default.
How to use it
Works on any symbol and timeframe that reports volume.
The reading to act on is not the break itself but the label under it. Supported, unconfirmed and contradicted are three different situations that look identical if you only watch price close beyond a line.
Contradicted breaks are the reason the script exists. A break that prints a reversal shape on its own bar is not automatically a fade, but it is a break that has not yet proven anything, and treating it identically to a supported one is how breakout traders get taken apart.
Raise the lookback for fewer and more significant levels. Raise the spacing setting if a trending instrument is still producing too many marks. Turn the structure read off entirely and it becomes a plain break-and-volume tool with nothing else changed.
What it cannot do
A contradicted break is a description of one bar, not a forecast. Some traps reverse immediately and some run for days before they do. The label says the evidence on that bar conflicts, and nothing more.
Candlestick patterns are shape definitions with no universally agreed thresholds. The definitions used here are listed above so you can check them against your own rather than trust mine. Piercing and dark cloud are implemented in the strict form requiring a genuine gap beyond the prior bar's extreme, which means they fire rarely on intraday charts where gaps are uncommon.
The level is a recent high or low and nothing more. It carries no weight from prior sessions, no volume profile, no higher timeframe context. A five-bar high on a quiet afternoon and a five-bar high at a weekly extreme are treated identically.
There are no entries, exits, targets or stops in this script, and no performance of any kind is claimed, measured or implied.
On authorship
Swing breakouts, relative volume and the classic candlestick reversal patterns are all public methodology and I have said so plainly. The implementation is not borrowed. Every line is written from scratch and no code in it is copied or adapted from another author's script, on this platform or anywhere else.
Settings
Lookback for the level, confirm-on-close and minimum spacing between marked breaks; volume average length and the strong-participation multiple; a master switch for the structure read plus a toggle per pattern family and the doji body fraction; and display options for the level lines, labels, plotted levels, bar colouring, label size and colours.
Release Note
Substantial rewrite. Events, grades, and readings will differ from the previous version.The core change is that three claims are now kept separate instead of being collapsed into one.
The event: price confirmed a close beyond a known prior level.
The initial grade: the break bar was supported, neutral, or contradicted by its own evidence.
The outcome: price either survived a fixed horizon or closed back through the level.
Initial contradiction is never relabeled as failure, and failure is never retroactively blamed on the grade. All three are reported separately, and a ledger shows how each grade actually resolved.
Levels
Two models. A rolling prior range that excludes the current bar, or confirmed pivots that activate only after right-side confirmation and therefore do not repaint.
Each pivot is consumed once, so a single pivot cannot generate a stream of events.
Break tolerance is now configurable in ticks or as a fraction of ATR, and the tolerance in force is frozen onto each event at the moment it starts.
A directional cooldown prevents cascading trend bars from producing a new event on every bar.
Participation
The default baseline is now same-clock robust: the median of log volume at this exact time slot across complete prior sessions, with a median-absolute-deviation spread that falls back to the interquartile range when it collapses.
Volume history is committed only for complete sessions. Half days, partial first days, missing bars, and early closes are excluded whole rather than distorting individual slots. The excluded count is reported.
The current bar is excluded from its own baseline. The prior-bar simple moving average alternative also excludes the current bar from its denominator.
The reading on a live bar is labeled provisional.
Grading
Contradicted: the break bar carries opposing reversal geometry, or closes weakly against its own direction.
Supported: participation, close location, body efficiency, and penetration depth all clear their thresholds with no opposing geometry.
Neutral: everything else.
Every threshold is an input. They are conventions, not calibrations.
Forward evaluation, which is new
Failure is a confirmed close returning through the level plus tolerance before the horizon ends. Survival is the horizon ending without such a close. A target touch is price reaching the configured ATR extension.
One unresolved event per direction is allowed, so a trend cannot be counted as many independent observations.
Events still open at a session boundary or at the chart edge are censored and never counted as wins or losses. The censored count is shown.
When a single bar touches both the target and the invalidation, OHLC cannot say which came first, so that bar receives no target credit and no favorable excursion credit. Adverse excursion is still recorded. Upgrading a result requires evidence; downgrading is the default.
The ledger
For each initial grade: how many events resolved, what share survived the horizon with a 95% Wilson interval, what share reached the target, and the median favorable and adverse excursion in ATR. This is the honest test of whether the grading is doing anything. If supported and contradicted breaks survive at the same rate on your instrument, the grade is not earning its place, and the table will say so.
Also added
Wick sweeps that push through a level and close back inside are annotated separately from breaks.
Ten alert conditions: confirmed break in each direction, supported break in each direction, contradicted break in each direction, each sweep, horizon survived, and acceptance failed.
Drawing budgets for labels and lines, so older history is not silently crowded out.
Requirements, which are stricter than before
Intraday, whole-minute chart timeframes only, because the same-clock baseline and the session logic have no meaning on daily or higher. The chart timeframe must divide the session start and the session length exactly. For a 09:30 to 16:00 session that is 1, 2, 3, 5, 6, 10, 15, or 30 minutes. This follows your session and is not a fixed ceiling: a session starting on the hour also accepts 20 and 60 minutes. Misaligned timeframes are refused with a message rather than measured against fuzzy session boundaries.
On colour
Green marks the fully supported grade, amber marks contradiction, grey is the neutral middle. The word is always printed beside the colour, so nothing here depends on hue alone.
Unchanged, and still the point: a grade describes the break bar's evidence. It is not a trade instruction, and nothing here forecasts direction. Survival is structural acceptance, not trade profitability.

คำจำกัดสิทธิ์ความรับผิดชอบ
ข้อมูลและบทความไม่ได้มีวัตถุประสงค์เพื่อก่อให้เกิดกิจกรรมทางการเงิน, การลงทุน, การซื้อขาย, ข้อเสนอแนะ หรือคำแนะนำประเภทอื่น ๆ ที่ให้หรือรับรองโดย TradingView อ่านเพิ่มเติมใน ข้อกำหนดการใช้งาน
คำจำกัดสิทธิ์ความรับผิดชอบ
ข้อมูลและบทความไม่ได้มีวัตถุประสงค์เพื่อก่อให้เกิดกิจกรรมทางการเงิน, การลงทุน, การซื้อขาย, ข้อเสนอแนะ หรือคำแนะนำประเภทอื่น ๆ ที่ให้หรือรับรองโดย TradingView อ่านเพิ่มเติมใน ข้อกำหนดการใช้งาน