ที่อัปเดต:
Supply & Demand Zones Liquidity & Stop Hunt [LunqFX]
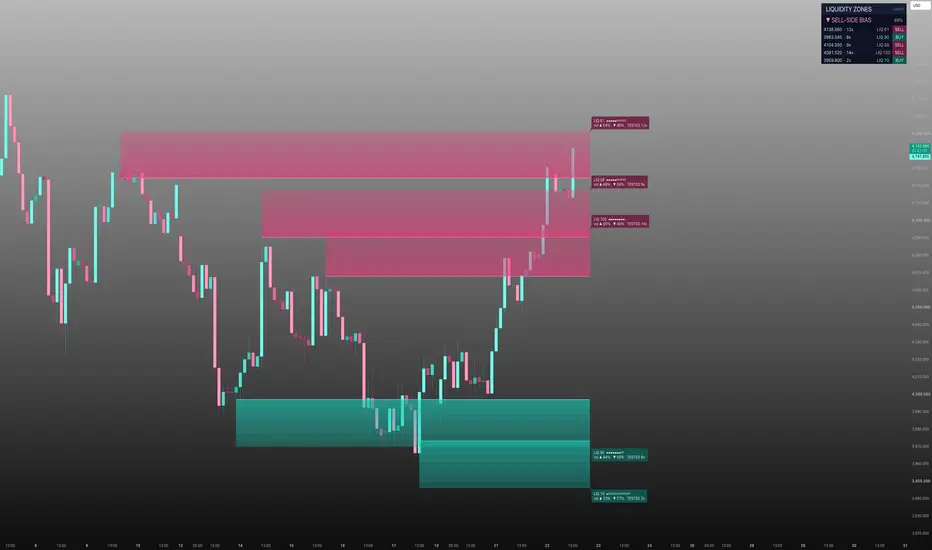
Supply and demand zones are where price reacts — but most indicators draw every swing as a box and leave you to guess which one matters. Liquidity Zones ranks them: it marks the key supply and demand zones, scores each one by how much liquidity it holds, and shows whether it is still fresh — so you know which level to trade and which to ignore.
❶ WHAT EACH ZONE SHOWS
Every zone is a coloured block — magenta = SUPPLY (sellers, above), teal = DEMAND (buyers, below) — and carries three readings that are original to this script:
LIQ SCORE (0–100) — how much volume traded inside the zone versus the strongest zone on the chart. 100 = the heaviest zone (the real magnet); a low score = a thin, weak level.
VOLUME ▲ / ▼ — the up-volume vs down-volume that built the zone: did buyers or sellers do the work inside it.
FRESH / TESTED N× — FRESH = price has not returned yet (strongest reaction expected); TESTED N× = already retested N times, weaker each time.
❷ HOW TO TRADE IT
1 — Read the BIAS in the panel. ▲ BUY-SIDE = favour longs, ▼ SELL-SIDE = favour shorts. Trade with it, not against it.
2 — Pick a zone with a HIGH LIQ Score (70+). Low-score zones are thin and unreliable — skip them.
3 — Prefer FRESH zones. A FRESH high-LIQ zone is the highest-probability reaction. A many-times-TESTED zone is more likely to break than hold.
4 — Wait for price to return to that zone. The bright edge line is your reference level.
5 — Enter on the reaction: LONG — bias BUY-SIDE, price drops into a FRESH teal DEMAND zone, LIQ 80, Volume ▲ (buyers dominant). Long on the reaction, stop below the zone, target the next supply zone above. SHORT — bias SELL-SIDE, price rallies into a FRESH magenta SUPPLY zone, LIQ 76, Volume ▼ (sellers dominant). Short on the reaction, stop above the zone, target the next demand zone below.
❸ WHAT TO AVOID
Trading low-LIQ zones — they hold little liquidity. Fading a zone whose Volume split disagrees with its side (e.g. a supply zone built on heavy up-volume) — the level is weak. Chasing a many-times-TESTED zone expecting a clean bounce.
Works on any symbol and timeframe — forex, gold (XAUUSD), indices, crypto and stocks — intraday and higher timeframes alike.
❹ DASHBOARD
The panel lists every zone with its price, LIQ Score, FRESH/TESTED status and side (BUY/SELL), plus a LIQ-weighted overall bias — the full picture at a glance. Optional neon candles can be turned off to keep your own style.
❺ HOW IT WORKS
1 — Swing highs and lows are found from confirmed pivots (closed bars — no repainting). Each swing high opens a supply zone, each swing low a demand zone. 2 — Each zone is a block centred on the swing, its height scaled to ATR so it fits the instrument's volatility. 3 — For every zone the script measures the volume traded inside it, the up/down-volume split, and how many separate times price entered it. 4 — LIQ Score = the zone's volume ÷ the strongest zone's volume, scaled 0–100. 5 — The bias is weighted by LIQ Score, so one heavy zone counts for more than several thin ones — an honest read of whether liquidity leans buy or sell.
No repainting
Zones are built only from confirmed pivots and rendered on the last bar over a fixed lookback. A zone that appears in a screenshot is a zone that was there live — history is never recalculated.
This indicator is an educational market-analysis tool, not financial advice. Zone strength and past reactions describe historical behavior and do not guarantee future results. Always confirm with your own analysis and manage risk.
❶ WHAT EACH ZONE SHOWS
Every zone is a coloured block — magenta = SUPPLY (sellers, above), teal = DEMAND (buyers, below) — and carries three readings that are original to this script:
LIQ SCORE (0–100) — how much volume traded inside the zone versus the strongest zone on the chart. 100 = the heaviest zone (the real magnet); a low score = a thin, weak level.
VOLUME ▲ / ▼ — the up-volume vs down-volume that built the zone: did buyers or sellers do the work inside it.
FRESH / TESTED N× — FRESH = price has not returned yet (strongest reaction expected); TESTED N× = already retested N times, weaker each time.
❷ HOW TO TRADE IT
1 — Read the BIAS in the panel. ▲ BUY-SIDE = favour longs, ▼ SELL-SIDE = favour shorts. Trade with it, not against it.
2 — Pick a zone with a HIGH LIQ Score (70+). Low-score zones are thin and unreliable — skip them.
3 — Prefer FRESH zones. A FRESH high-LIQ zone is the highest-probability reaction. A many-times-TESTED zone is more likely to break than hold.
4 — Wait for price to return to that zone. The bright edge line is your reference level.
5 — Enter on the reaction: LONG — bias BUY-SIDE, price drops into a FRESH teal DEMAND zone, LIQ 80, Volume ▲ (buyers dominant). Long on the reaction, stop below the zone, target the next supply zone above. SHORT — bias SELL-SIDE, price rallies into a FRESH magenta SUPPLY zone, LIQ 76, Volume ▼ (sellers dominant). Short on the reaction, stop above the zone, target the next demand zone below.
❸ WHAT TO AVOID
Trading low-LIQ zones — they hold little liquidity. Fading a zone whose Volume split disagrees with its side (e.g. a supply zone built on heavy up-volume) — the level is weak. Chasing a many-times-TESTED zone expecting a clean bounce.
Works on any symbol and timeframe — forex, gold (XAUUSD), indices, crypto and stocks — intraday and higher timeframes alike.
❹ DASHBOARD
The panel lists every zone with its price, LIQ Score, FRESH/TESTED status and side (BUY/SELL), plus a LIQ-weighted overall bias — the full picture at a glance. Optional neon candles can be turned off to keep your own style.
❺ HOW IT WORKS
1 — Swing highs and lows are found from confirmed pivots (closed bars — no repainting). Each swing high opens a supply zone, each swing low a demand zone. 2 — Each zone is a block centred on the swing, its height scaled to ATR so it fits the instrument's volatility. 3 — For every zone the script measures the volume traded inside it, the up/down-volume split, and how many separate times price entered it. 4 — LIQ Score = the zone's volume ÷ the strongest zone's volume, scaled 0–100. 5 — The bias is weighted by LIQ Score, so one heavy zone counts for more than several thin ones — an honest read of whether liquidity leans buy or sell.
No repainting
Zones are built only from confirmed pivots and rendered on the last bar over a fixed lookback. A zone that appears in a screenshot is a zone that was there live — history is never recalculated.
This indicator is an educational market-analysis tool, not financial advice. Zone strength and past reactions describe historical behavior and do not guarantee future results. Always confirm with your own analysis and manage risk.
Release Note
🔧 Update — Bug Fixes & StabilityThe problem:
Some users hit constant runtime errors, especially on lower timeframes (1m, 5m) — the indicator would throw "calculation timed out" and stop working.
What's fixed:
✅ No more runtime errors — the indicator now runs stably on all timeframes
✅ Much better performance — zone calculations were running on every tick; they now run once per closed bar, which removes the timeouts and stops chart lag
✅ Fixed history overflow — on charts with limited data or high Lookback values, the script could request bars beyond available history; the scan range is now properly bounded and the data buffer expanded
✅ Smoother dashboard — the stats panel no longer flickers on every tick, and is fully non-repainting
Important: No logic changed. Zones, LIQ Score, buy/sell pressure %, FRESH/TESTED tags, bias, and the neon candles are all identical — values on closed bars are exactly the same as before. This is purely a stability and performance fix.

Trade setups with clear entry, stop, target and risk logic. Built for traders who want structure, not guessing.
💬 t.me/lunqfx
🌐 lunqfx.com/premium
💬 t.me/lunqfx
🌐 lunqfx.com/premium
คำจำกัดสิทธิ์ความรับผิดชอบ
ข้อมูลและบทความไม่ได้มีวัตถุประสงค์เพื่อก่อให้เกิดกิจกรรมทางการเงิน, การลงทุน, การซื้อขาย, ข้อเสนอแนะ หรือคำแนะนำประเภทอื่น ๆ ที่ให้หรือรับรองโดย TradingView อ่านเพิ่มเติมใน ข้อกำหนดการใช้งาน
Trade setups with clear entry, stop, target and risk logic. Built for traders who want structure, not guessing.
💬 t.me/lunqfx
🌐 lunqfx.com/premium
💬 t.me/lunqfx
🌐 lunqfx.com/premium
คำจำกัดสิทธิ์ความรับผิดชอบ
ข้อมูลและบทความไม่ได้มีวัตถุประสงค์เพื่อก่อให้เกิดกิจกรรมทางการเงิน, การลงทุน, การซื้อขาย, ข้อเสนอแนะ หรือคำแนะนำประเภทอื่น ๆ ที่ให้หรือรับรองโดย TradingView อ่านเพิ่มเติมใน ข้อกำหนดการใช้งาน