OPEN-SOURCE SCRIPT
Permutation Entropy Regime [Jayadev Rana]
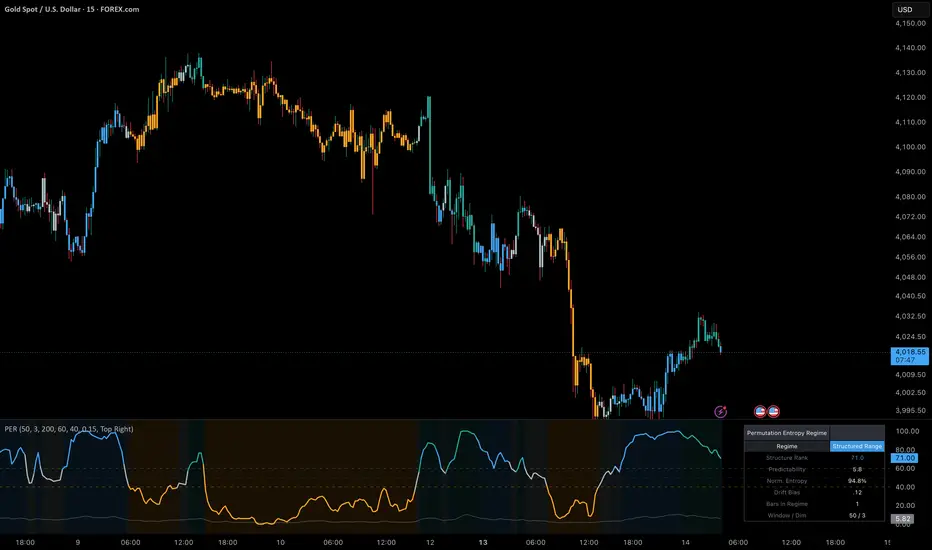
Permutation Entropy Regime
OVERVIEW
Permutation Entropy Regime is an original open-source tool that measures how ordered or random recent price action is, and turns that into a simple market-state read. Instead of moving averages or momentum, it borrows an idea from information theory called permutation entropy (the Bandt-Pompe method) to score the "predictability" of the market, then classifies the current bar into one of five regimes.
It is not a buy/sell signal generator. It is a context and filter tool that tries to answer one question: is the market currently structured enough to trend or swing, or is it behaving like random noise where most systematic edges break down?
HOW IT WORKS
1. Ordinal patterns. Over a rolling window of closes, the script looks at every group of three consecutive closes and records their rank order (which is highest, middle, lowest). With three values there are six possible orderings.
2. Permutation entropy. It builds a histogram of how often each of the six orderings appears in the window, then computes the Shannon entropy of that distribution and normalizes it to a 0-1 scale. A low value means a few orderings dominate (structured, repeatable behavior); a high value means all orderings appear about equally (random-walk-like behavior).
3. Predictability. Predictability is reported as (1 - normalized entropy) x 100. Higher means more ordered.
4. Structure Rank. Because raw predictability sits in different ranges on different symbols and timeframes, the script percentile-ranks the current predictability against its own recent history (Structure Rank Lookback). This adaptive 0-100 Structure Rank is the main line and the basis for the regime decision, so the tool self-calibrates to each market.
5. Drift bias. A separate term measures the net share of up versus down closes across the window (-1 to +1). It is used only to label a structured regime as Up, Down, or Range.
REGIMES
- Structured Up: Structure Rank at or above the Structured Level and drift bias positive.
- Structured Down: Structure Rank at or above the Structured Level and drift bias negative.
- Structured Range: Structure Rank high but drift near zero (ordered but sideways or mean-reverting).
- Neutral: Structure Rank between the two levels.
- Random / Chop: Structure Rank at or below the Chop Level.
INPUTS
- Core: Entropy Window (window length for the ordinal-pattern histogram) and Predictability Smoothing (EMA applied to the raw score).
- Regime: Structure Rank Lookback (adaptive percentile window), Structured Level and Chop Level (the two cutoffs), and Drift Bias Threshold (how strong the directional tilt must be to call Up or Down).
- Visuals: color price bars by regime, shade the indicator pane by regime, show the dashboard and choose its corner.
- Colors: one color per regime.
WHAT IT PLOTS
- Structure Rank line (0-100), colored by the active regime.
- Raw Predictability line for reference.
- Dashed Structured Level, Chop Level, and a midline.
- Optional regime background in the pane, and optional regime coloring of the main price bars.
- A dashboard showing the regime, Structure Rank, Predictability, normalized entropy, drift bias, and how many bars the current regime has lasted.
ALERTS
Five bar-close alertconditions: entered Structured Up, entered Structured Down, entered Structured Range, entered Random / Chop, and a generic Regime Changed. They evaluate on confirmed bar close.
HOW TO USE IT
This is a context filter, not a signal by itself. Common uses:
- Take your own trend or breakout setups mainly while the market is in a Structured Up or Structured Down regime, and stand aside or reduce size in Random / Chop.
- Prefer mean-reversion or range tactics in Structured Range.
- Combine the regime with your existing entries rather than acting on the regime alone.
MARKETS AND TIMEFRAMES
It is symbol- and timeframe-agnostic because the Structure Rank adapts to each market's own history. It runs on intraday and higher timeframes. Note that most liquid instruments are close to random at short intraday scales, so absolute Predictability is often low; the Structure Rank is what makes the reading comparable and actionable across markets.
CALCULATION AND REPAINTING NOTES
- All calculations use closed-bar data (close and historical closes). Values for the most recent, still-forming bar update until that bar closes, which is normal for any close-based indicator; historical values do not repaint after a bar has closed.
- The embedding dimension is fixed at 3 (groups of three closes). Ties between equal closes are resolved with a consistent rule and are rare on most instruments.
- There are no higher-timeframe requests and no future-looking access.
LIMITATIONS
- It measures structure, not direction quality; a structured regime is not a guarantee of follow-through.
- Permutation entropy of order 3 is a coarse estimate; very small windows are noisy and very large windows are slow to react.
- On extremely low-volatility or illiquid data, repeated equal closes can bias the pattern histogram.
- Like all indicators, it describes past and current behavior and does not predict future prices.
This script is open-source under the Mozilla Public License 2.0. It is provided for research and educational purposes only and is not financial advice. Test any tool on your own markets and settings before relying on it.
Open-source script
In true TradingView spirit, the creator of this script has made it open-source, so that traders can review and verify its functionality. Kudos to the author! While you can use it for free, remember that republishing the code is subject to our House Rules.
bluealgocapital
Disclaimer
The information and publications are not meant to be, and do not constitute, financial, investment, trading, or other types of advice or recommendations supplied or endorsed by TradingView. Read more in the Terms of Use.
OVERVIEW
Permutation Entropy Regime is an original open-source tool that measures how ordered or random recent price action is, and turns that into a simple market-state read. Instead of moving averages or momentum, it borrows an idea from information theory called permutation entropy (the Bandt-Pompe method) to score the "predictability" of the market, then classifies the current bar into one of five regimes.
It is not a buy/sell signal generator. It is a context and filter tool that tries to answer one question: is the market currently structured enough to trend or swing, or is it behaving like random noise where most systematic edges break down?
HOW IT WORKS
1. Ordinal patterns. Over a rolling window of closes, the script looks at every group of three consecutive closes and records their rank order (which is highest, middle, lowest). With three values there are six possible orderings.
2. Permutation entropy. It builds a histogram of how often each of the six orderings appears in the window, then computes the Shannon entropy of that distribution and normalizes it to a 0-1 scale. A low value means a few orderings dominate (structured, repeatable behavior); a high value means all orderings appear about equally (random-walk-like behavior).
3. Predictability. Predictability is reported as (1 - normalized entropy) x 100. Higher means more ordered.
4. Structure Rank. Because raw predictability sits in different ranges on different symbols and timeframes, the script percentile-ranks the current predictability against its own recent history (Structure Rank Lookback). This adaptive 0-100 Structure Rank is the main line and the basis for the regime decision, so the tool self-calibrates to each market.
5. Drift bias. A separate term measures the net share of up versus down closes across the window (-1 to +1). It is used only to label a structured regime as Up, Down, or Range.
REGIMES
- Structured Up: Structure Rank at or above the Structured Level and drift bias positive.
- Structured Down: Structure Rank at or above the Structured Level and drift bias negative.
- Structured Range: Structure Rank high but drift near zero (ordered but sideways or mean-reverting).
- Neutral: Structure Rank between the two levels.
- Random / Chop: Structure Rank at or below the Chop Level.
INPUTS
- Core: Entropy Window (window length for the ordinal-pattern histogram) and Predictability Smoothing (EMA applied to the raw score).
- Regime: Structure Rank Lookback (adaptive percentile window), Structured Level and Chop Level (the two cutoffs), and Drift Bias Threshold (how strong the directional tilt must be to call Up or Down).
- Visuals: color price bars by regime, shade the indicator pane by regime, show the dashboard and choose its corner.
- Colors: one color per regime.
WHAT IT PLOTS
- Structure Rank line (0-100), colored by the active regime.
- Raw Predictability line for reference.
- Dashed Structured Level, Chop Level, and a midline.
- Optional regime background in the pane, and optional regime coloring of the main price bars.
- A dashboard showing the regime, Structure Rank, Predictability, normalized entropy, drift bias, and how many bars the current regime has lasted.
ALERTS
Five bar-close alertconditions: entered Structured Up, entered Structured Down, entered Structured Range, entered Random / Chop, and a generic Regime Changed. They evaluate on confirmed bar close.
HOW TO USE IT
This is a context filter, not a signal by itself. Common uses:
- Take your own trend or breakout setups mainly while the market is in a Structured Up or Structured Down regime, and stand aside or reduce size in Random / Chop.
- Prefer mean-reversion or range tactics in Structured Range.
- Combine the regime with your existing entries rather than acting on the regime alone.
MARKETS AND TIMEFRAMES
It is symbol- and timeframe-agnostic because the Structure Rank adapts to each market's own history. It runs on intraday and higher timeframes. Note that most liquid instruments are close to random at short intraday scales, so absolute Predictability is often low; the Structure Rank is what makes the reading comparable and actionable across markets.
CALCULATION AND REPAINTING NOTES
- All calculations use closed-bar data (close and historical closes). Values for the most recent, still-forming bar update until that bar closes, which is normal for any close-based indicator; historical values do not repaint after a bar has closed.
- The embedding dimension is fixed at 3 (groups of three closes). Ties between equal closes are resolved with a consistent rule and are rare on most instruments.
- There are no higher-timeframe requests and no future-looking access.
LIMITATIONS
- It measures structure, not direction quality; a structured regime is not a guarantee of follow-through.
- Permutation entropy of order 3 is a coarse estimate; very small windows are noisy and very large windows are slow to react.
- On extremely low-volatility or illiquid data, repeated equal closes can bias the pattern histogram.
- Like all indicators, it describes past and current behavior and does not predict future prices.
This script is open-source under the Mozilla Public License 2.0. It is provided for research and educational purposes only and is not financial advice. Test any tool on your own markets and settings before relying on it.
Open-source script
In true TradingView spirit, the creator of this script has made it open-source, so that traders can review and verify its functionality. Kudos to the author! While you can use it for free, remember that republishing the code is subject to our House Rules.
bluealgocapital
Disclaimer
The information and publications are not meant to be, and do not constitute, financial, investment, trading, or other types of advice or recommendations supplied or endorsed by TradingView. Read more in the Terms of Use.
สคริปต์โอเพนซอร์ซ
ด้วยเจตนารมณ์หลักของ TradingView ผู้สร้างสคริปต์นี้ได้ทำให้เป็นโอเพนซอร์ส เพื่อให้เทรดเดอร์สามารถตรวจสอบและยืนยันฟังก์ชันการทำงานของมันได้ ขอชื่นชมผู้เขียน! แม้ว่าคุณจะใช้งานได้ฟรี แต่โปรดจำไว้ว่าการเผยแพร่โค้ดซ้ำจะต้องเป็นไปตาม กฎระเบียบการใช้งาน ของเรา

คำจำกัดสิทธิ์ความรับผิดชอบ
ข้อมูลและบทความไม่ได้มีวัตถุประสงค์เพื่อก่อให้เกิดกิจกรรมทางการเงิน, การลงทุน, การซื้อขาย, ข้อเสนอแนะ หรือคำแนะนำประเภทอื่น ๆ ที่ให้หรือรับรองโดย TradingView อ่านเพิ่มเติมใน ข้อกำหนดการใช้งาน
สคริปต์โอเพนซอร์ซ
ด้วยเจตนารมณ์หลักของ TradingView ผู้สร้างสคริปต์นี้ได้ทำให้เป็นโอเพนซอร์ส เพื่อให้เทรดเดอร์สามารถตรวจสอบและยืนยันฟังก์ชันการทำงานของมันได้ ขอชื่นชมผู้เขียน! แม้ว่าคุณจะใช้งานได้ฟรี แต่โปรดจำไว้ว่าการเผยแพร่โค้ดซ้ำจะต้องเป็นไปตาม กฎระเบียบการใช้งาน ของเรา
คำจำกัดสิทธิ์ความรับผิดชอบ
ข้อมูลและบทความไม่ได้มีวัตถุประสงค์เพื่อก่อให้เกิดกิจกรรมทางการเงิน, การลงทุน, การซื้อขาย, ข้อเสนอแนะ หรือคำแนะนำประเภทอื่น ๆ ที่ให้หรือรับรองโดย TradingView อ่านเพิ่มเติมใน ข้อกำหนดการใช้งาน