OPEN-SOURCE SCRIPT
Volatility Epicenter and Aftershocks
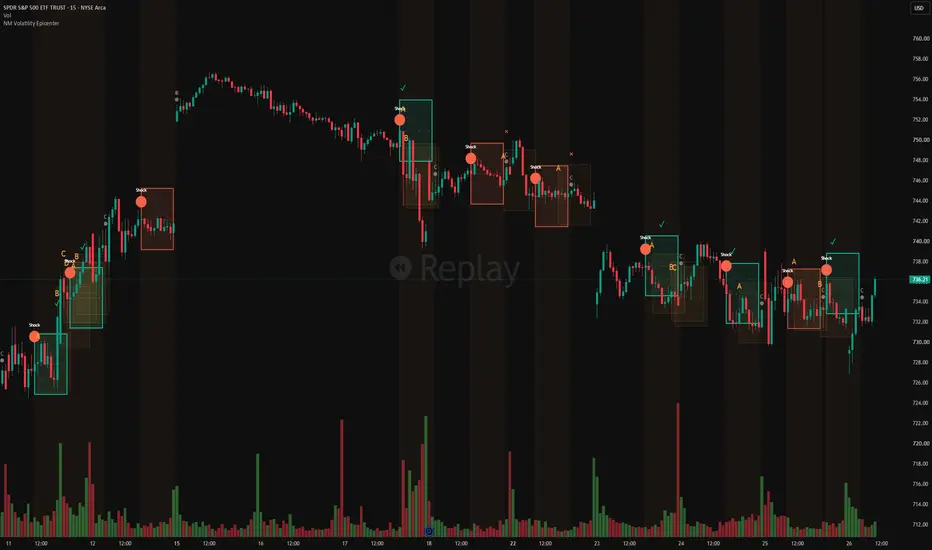
Volatility Epicenter and Aftershocks is an event-conditioned market-memory indicator. It detects moments when a recent six-bar path is unusually dominated by one or two returns and unusually active relative to the same part of the trading session.

When a primary Shock is confirmed, the indicator freezes a movement box around that bar's close. The box does not say price will rise or fall. Its height comes from the maximum excursions of completed historical Shock events over the same forward horizon.
HOW MARKET MEMORY WORKS

This script does not use an LSTM or neural network. Its memory consists of rolling empirical distributions and a transparent event-state machine.
For log return r(t) = ln(Close(t) / Close(t−1)), the recent path and volatility concentration are:
Path = Σ|r|
Concentration = Σr⁴ / (Σr²)²
Seasonal memory compares the current Path with its median at the same time in previous sessions:
Seasonal Ratio = Current Path / Same-Time Historical Median
A Shock occurs when both Concentration and Seasonal Ratio exceed their rolling percentile thresholds. Thresholds are calculated before adding the current observation, preventing leakage.
After each Shock matures, the script stores its maximum 3-, 5- and 10-bar excursion:
Excursion(h) = max[ln(Highest(h) / Shock Close), |ln(Lowest(h) / Shock Close)|]
The box uses the selected percentile of completed 10-bar excursions:
Upper = Shock Close × exp(Excursion Percentile)
Lower = Shock Close × exp(−Excursion Percentile)
The first Shock fixes the box and expiry. Additional detections inside that window become A, B, C aftershocks without restarting it.
In simplified form:
shock = concentration >= historical_threshold
and seasonal_ratio >= historical_threshold
box_height = percentile(completed_shock_excursions)
This is empirical market memory—not ATR, candle-size projection or black-box prediction.
Why this is not another breakout or large-candle script
• A breakout is defined by price crossing a level. Epicenter does not use support, resistance, channels, or prior highs and lows to define a Shock.
• A large-candle alert is usually defined by one candle's body or range. Epicenter evaluates the structure of a multi-bar return path.
• ATR measures average true range. Epicenter asks whether the same amount of movement arrived in a concentrated burst rather than being distributed across bars.
• The empirical box is not an ATR multiple and is not projected from the Shock candle's size. It is learned from completed post-Shock excursions.
What market memory means
Read the chart in ten seconds

• Shock - the primary volatility event. It starts the original movement window.
• Solid rectangle - the empirical range associated with the primary shock.
• A, B, C... - additional shocks detected before the original window ends.
• Dotted rectangles - aftershock context. They are not scored as separate targets.
• Standalone green check - price reached either boundary of the primary box before expiry.
• Standalone red cross - the original window ended before either boundary was reached.
What the box means

The range is learned from the maximum excursions of completed historical shock events. Box-height percentile controls how wide that range is:
• P50 is the typical reach. Approximately half of comparable completed shocks moved farther and half moved less.
• P85 is a wider stress envelope. Only a smaller minority of comparable completed shocks moved farther.
The box is symmetric because the model estimates movement magnitude, not direction. A wider box is not a stronger bullish or bearish opinion.
Practical use
• Separate an ordinary large candle from a path whose volatility structure is genuinely unusual for that session time.
• Add event context to a breakout: a breakout with no Shock is a level event; a breakout with a Shock also carries concentrated-volatility risk.
• Recognize a Shock inside a range even when no breakout system would react.
• Use P50 as a typical remembered excursion and P85 as a wider stress envelope when planning exposure, stops, or monitoring intensity.
• Audit whether the remembered boundary was reached before the original ten-bar window cooled.
How the event is detected
The engine uses confirmed chart bars and combines two conditions across the recent six-bar path:
1. Variance concentration: whether one or two returns dominate the recent path's realized variance.
2. Seasonal volatility abnormality: how active the recent path is compared with the same bar position in prior sessions.
A primary event appears only when both measures exceed their rolling thresholds. Additional detections inside the primary window are labelled as aftershocks rather than restarting the main outcome test.
Non-repainting design
• Events are confirmed only after a chart bar closes.
• The primary box coordinates are frozen when created.
• Aftershocks do not extend or reset the primary box's original window.
• A check or X is added only after the corresponding outcome is observable.
• Keep all preserves historical boxes for audit. Latest only is an explicit display choice that suppresses secondary boxes.
Recommended starting setup
• Timeframe: 15 minutes.
• Session preset: Auto.
• Box-height percentile: 50.
• Box history: Keep all.
• Zone annotations: Marks only.
Recommended presets:

SPY, QQQ and US stocks: US ETF RTH
NQ and ES: CME equity futures
Gold, Silver and energy futures: Metals / energy futures
Bitcoin and crypto: Crypto 24/7
NIFTY and BANKNIFTY: Custom session, 09:15 start and 25 bars per session on a 15-minute chart
BOX HEIGHT

P50 shows the typical historical reach and is the recommended default.
P60 to P75 shows an expanded movement range.
P80 to P85 shows a wider stress envelope.
A higher percentile is not a stronger prediction. It simply displays a wider historical range.
HIGHER-TIMEFRAME BOXES
Use Adaptive mode on charts above 15 minutes. Boxes become available after five completed Shock outcomes and may use outcomes that cross session boundaries.
Strict mode requires the full historical sample and same-session outcomes.
Early Shocks may appear without boxes while the market memory is warming up. The script does not add boxes retrospectively because that would introduce lookahead.
DISPLAY

Keep all preserves historical boxes for auditing.
Latest only keeps the newest primary box.
Marks only is recommended. It displays checks and crosses without adding text inside boxes.
Full text adds explanations inside boxes but may become crowded.
SENSITIVITY

Recommended balanced settings are a six-bar path, concentration percentile of 80, seasonal-volatility percentile of 50 and a ten-bar aftershock window.
Higher thresholds produce fewer and more exceptional Shocks. Lower thresholds produce more signals.
Changing the timeframe, session preset or detection settings recalculates the model across the available chart history. This is recalculation under a different configuration, not repainting.
Session presets are included for US ETF regular hours, CME equity futures, metals and energy futures, crypto, and custom sessions. The model must collect enough calibration and completed-event history before boxes can be displayed.

ALERTS
• Primary volatility epicenter detected.
• Secondary aftershock detected.
• Projected percentile boundary achieved.
• Original aftershock window cooled.
Important limitations
• This is not a buy/sell system and does not predict direction.
• The empirical range describes this symbol's observed history; it is not a guarantee of
When a primary Shock is confirmed, the indicator freezes a movement box around that bar's close. The box does not say price will rise or fall. Its height comes from the maximum excursions of completed historical Shock events over the same forward horizon.
HOW MARKET MEMORY WORKS
This script does not use an LSTM or neural network. Its memory consists of rolling empirical distributions and a transparent event-state machine.
For log return r(t) = ln(Close(t) / Close(t−1)), the recent path and volatility concentration are:
Path = Σ|r|
Concentration = Σr⁴ / (Σr²)²
Seasonal memory compares the current Path with its median at the same time in previous sessions:
Seasonal Ratio = Current Path / Same-Time Historical Median
A Shock occurs when both Concentration and Seasonal Ratio exceed their rolling percentile thresholds. Thresholds are calculated before adding the current observation, preventing leakage.
After each Shock matures, the script stores its maximum 3-, 5- and 10-bar excursion:
Excursion(h) = max[ln(Highest(h) / Shock Close), |ln(Lowest(h) / Shock Close)|]
The box uses the selected percentile of completed 10-bar excursions:
Upper = Shock Close × exp(Excursion Percentile)
Lower = Shock Close × exp(−Excursion Percentile)
The first Shock fixes the box and expiry. Additional detections inside that window become A, B, C aftershocks without restarting it.
In simplified form:
shock = concentration >= historical_threshold
and seasonal_ratio >= historical_threshold
box_height = percentile(completed_shock_excursions)
This is empirical market memory—not ATR, candle-size projection or black-box prediction.
Why this is not another breakout or large-candle script
• A breakout is defined by price crossing a level. Epicenter does not use support, resistance, channels, or prior highs and lows to define a Shock.
• A large-candle alert is usually defined by one candle's body or range. Epicenter evaluates the structure of a multi-bar return path.
• ATR measures average true range. Epicenter asks whether the same amount of movement arrived in a concentrated burst rather than being distributed across bars.
• The empirical box is not an ATR multiple and is not projected from the Shock candle's size. It is learned from completed post-Shock excursions.
What market memory means
Read the chart in ten seconds
• Shock - the primary volatility event. It starts the original movement window.
• Solid rectangle - the empirical range associated with the primary shock.
• A, B, C... - additional shocks detected before the original window ends.
• Dotted rectangles - aftershock context. They are not scored as separate targets.
• Standalone green check - price reached either boundary of the primary box before expiry.
• Standalone red cross - the original window ended before either boundary was reached.
What the box means
The range is learned from the maximum excursions of completed historical shock events. Box-height percentile controls how wide that range is:
• P50 is the typical reach. Approximately half of comparable completed shocks moved farther and half moved less.
• P85 is a wider stress envelope. Only a smaller minority of comparable completed shocks moved farther.
The box is symmetric because the model estimates movement magnitude, not direction. A wider box is not a stronger bullish or bearish opinion.
Practical use
• Separate an ordinary large candle from a path whose volatility structure is genuinely unusual for that session time.
• Add event context to a breakout: a breakout with no Shock is a level event; a breakout with a Shock also carries concentrated-volatility risk.
• Recognize a Shock inside a range even when no breakout system would react.
• Use P50 as a typical remembered excursion and P85 as a wider stress envelope when planning exposure, stops, or monitoring intensity.
• Audit whether the remembered boundary was reached before the original ten-bar window cooled.
How the event is detected
The engine uses confirmed chart bars and combines two conditions across the recent six-bar path:
1. Variance concentration: whether one or two returns dominate the recent path's realized variance.
2. Seasonal volatility abnormality: how active the recent path is compared with the same bar position in prior sessions.
A primary event appears only when both measures exceed their rolling thresholds. Additional detections inside the primary window are labelled as aftershocks rather than restarting the main outcome test.
Non-repainting design
• Events are confirmed only after a chart bar closes.
• The primary box coordinates are frozen when created.
• Aftershocks do not extend or reset the primary box's original window.
• A check or X is added only after the corresponding outcome is observable.
• Keep all preserves historical boxes for audit. Latest only is an explicit display choice that suppresses secondary boxes.
Recommended starting setup
• Timeframe: 15 minutes.
• Session preset: Auto.
• Box-height percentile: 50.
• Box history: Keep all.
• Zone annotations: Marks only.
Recommended presets:
SPY, QQQ and US stocks: US ETF RTH
NQ and ES: CME equity futures
Gold, Silver and energy futures: Metals / energy futures
Bitcoin and crypto: Crypto 24/7
NIFTY and BANKNIFTY: Custom session, 09:15 start and 25 bars per session on a 15-minute chart
BOX HEIGHT
P50 shows the typical historical reach and is the recommended default.
P60 to P75 shows an expanded movement range.
P80 to P85 shows a wider stress envelope.
A higher percentile is not a stronger prediction. It simply displays a wider historical range.
HIGHER-TIMEFRAME BOXES
Use Adaptive mode on charts above 15 minutes. Boxes become available after five completed Shock outcomes and may use outcomes that cross session boundaries.
Strict mode requires the full historical sample and same-session outcomes.
Early Shocks may appear without boxes while the market memory is warming up. The script does not add boxes retrospectively because that would introduce lookahead.
DISPLAY
Keep all preserves historical boxes for auditing.
Latest only keeps the newest primary box.
Marks only is recommended. It displays checks and crosses without adding text inside boxes.
Full text adds explanations inside boxes but may become crowded.
SENSITIVITY
Recommended balanced settings are a six-bar path, concentration percentile of 80, seasonal-volatility percentile of 50 and a ten-bar aftershock window.
Higher thresholds produce fewer and more exceptional Shocks. Lower thresholds produce more signals.
Changing the timeframe, session preset or detection settings recalculates the model across the available chart history. This is recalculation under a different configuration, not repainting.
Session presets are included for US ETF regular hours, CME equity futures, metals and energy futures, crypto, and custom sessions. The model must collect enough calibration and completed-event history before boxes can be displayed.
ALERTS
• Primary volatility epicenter detected.
• Secondary aftershock detected.
• Projected percentile boundary achieved.
• Original aftershock window cooled.
Important limitations
• This is not a buy/sell system and does not predict direction.
• The empirical range describes this symbol's observed history; it is not a guarantee of
สคริปต์แบบโอเพนซอร์ส
ด้วยเจตนารมณ์หลักของ TradingView ผู้สร้างสคริปต์นี้ได้ทำให้เป็นโอเพนซอร์ส เพื่อให้เทรดเดอร์สามารถตรวจสอบและยืนยันฟังก์ชันการทำงานของมันได้ ขอชื่นชมผู้เขียน! แม้ว่าคุณจะใช้งานได้ฟรี แต่โปรดจำไว้ว่าการเผยแพร่โค้ดซ้ำจะต้องเป็นไปตาม กฎระเบียบการใช้งาน ของเรา

Machine-learning market structure & forecast levels. Publishing levels before the markets move. Educational only.
คำจำกัดสิทธิ์ความรับผิดชอบ
ข้อมูลและบทความไม่ได้มีวัตถุประสงค์เพื่อก่อให้เกิดกิจกรรมทางการเงิน, การลงทุน, การซื้อขาย, ข้อเสนอแนะ หรือคำแนะนำประเภทอื่น ๆ ที่ให้หรือรับรองโดย TradingView อ่านเพิ่มเติมใน ข้อกำหนดการใช้งาน
สคริปต์แบบโอเพนซอร์ส
ด้วยเจตนารมณ์หลักของ TradingView ผู้สร้างสคริปต์นี้ได้ทำให้เป็นโอเพนซอร์ส เพื่อให้เทรดเดอร์สามารถตรวจสอบและยืนยันฟังก์ชันการทำงานของมันได้ ขอชื่นชมผู้เขียน! แม้ว่าคุณจะใช้งานได้ฟรี แต่โปรดจำไว้ว่าการเผยแพร่โค้ดซ้ำจะต้องเป็นไปตาม กฎระเบียบการใช้งาน ของเรา
Machine-learning market structure & forecast levels. Publishing levels before the markets move. Educational only.
คำจำกัดสิทธิ์ความรับผิดชอบ
ข้อมูลและบทความไม่ได้มีวัตถุประสงค์เพื่อก่อให้เกิดกิจกรรมทางการเงิน, การลงทุน, การซื้อขาย, ข้อเสนอแนะ หรือคำแนะนำประเภทอื่น ๆ ที่ให้หรือรับรองโดย TradingView อ่านเพิ่มเติมใน ข้อกำหนดการใช้งาน