OPEN-SOURCE SCRIPT
SMC Level Analyzer
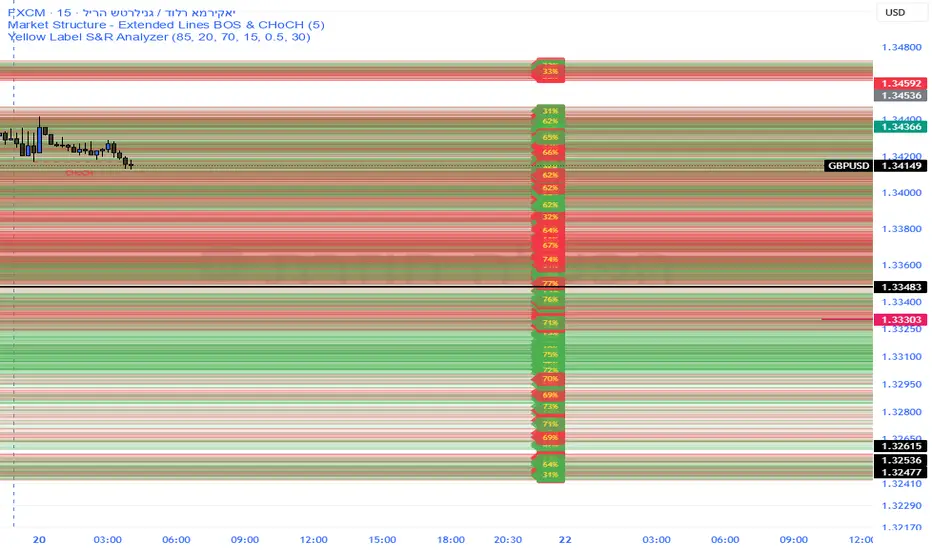
Precision S&R Strength – Indicator Description
Overview
The Precision S&R Strength analyzer is a sophisticated technical tool designed to identify and quantify the importance of Support and Resistance levels. Unlike standard pivot-point indicators, this script calculates a dynamic strength percentage for each level based on historical price interaction and accumulated trading volume.
Core Functionality
Smart Level Detection: Automatically identifies key high and low pivot points.
Volume & Touch Analysis: Each level is back-tested against the last 300 candles. The strength percentage (displayed on the right margin) is a weighted calculation of how many times the price reacted to the zone and the volume transacted at those prices.
Supply & Demand Zones: Visualizes levels as horizontal "boxes" (Zones) rather than simple lines, representing the actual price range where orders are clustered.
Clean Visuals: All data labels are anchored to the right-side margin, keeping the main chart clean and focused on price movement.
Strategic Purpose & Risk Warning
CRITICAL: This indicator is NOT a standalone "Buy/Sell" signal generator.
The primary goal of this tool is to act as a Confluence Factor (Secondary Confirmation) for your trading strategy. To trade successfully with this indicator, you must:
Analyze Price Action: Look for candlestick patterns (like pin bars or engulfing candles) near the highlighted zones.
Follow the Trend: Always align your trades with the overall market structure (Order Flow). A "90% strength" resistance level is more likely to break if the macro trend is strongly bullish.
Use as Confirmation: Use the strength percentage to filter out "weak" levels and focus only on high-probability zones where smart money has previously shown interest.
Trading involves significant risk. Never rely solely on a single indicator for execution.
Overview
The Precision S&R Strength analyzer is a sophisticated technical tool designed to identify and quantify the importance of Support and Resistance levels. Unlike standard pivot-point indicators, this script calculates a dynamic strength percentage for each level based on historical price interaction and accumulated trading volume.
Core Functionality
Smart Level Detection: Automatically identifies key high and low pivot points.
Volume & Touch Analysis: Each level is back-tested against the last 300 candles. The strength percentage (displayed on the right margin) is a weighted calculation of how many times the price reacted to the zone and the volume transacted at those prices.
Supply & Demand Zones: Visualizes levels as horizontal "boxes" (Zones) rather than simple lines, representing the actual price range where orders are clustered.
Clean Visuals: All data labels are anchored to the right-side margin, keeping the main chart clean and focused on price movement.
Strategic Purpose & Risk Warning
CRITICAL: This indicator is NOT a standalone "Buy/Sell" signal generator.
The primary goal of this tool is to act as a Confluence Factor (Secondary Confirmation) for your trading strategy. To trade successfully with this indicator, you must:
Analyze Price Action: Look for candlestick patterns (like pin bars or engulfing candles) near the highlighted zones.
Follow the Trend: Always align your trades with the overall market structure (Order Flow). A "90% strength" resistance level is more likely to break if the macro trend is strongly bullish.
Use as Confirmation: Use the strength percentage to filter out "weak" levels and focus only on high-probability zones where smart money has previously shown interest.
Trading involves significant risk. Never rely solely on a single indicator for execution.
สคริปต์โอเพนซอร์ซ
ด้วยเจตนารมณ์หลักของ TradingView ผู้สร้างสคริปต์นี้ได้ทำให้เป็นโอเพนซอร์ส เพื่อให้เทรดเดอร์สามารถตรวจสอบและยืนยันฟังก์ชันการทำงานของมันได้ ขอชื่นชมผู้เขียน! แม้ว่าคุณจะใช้งานได้ฟรี แต่โปรดจำไว้ว่าการเผยแพร่โค้ดซ้ำจะต้องเป็นไปตาม กฎระเบียบการใช้งาน ของเรา

คำจำกัดสิทธิ์ความรับผิดชอบ
ข้อมูลและบทความไม่ได้มีวัตถุประสงค์เพื่อก่อให้เกิดกิจกรรมทางการเงิน, การลงทุน, การซื้อขาย, ข้อเสนอแนะ หรือคำแนะนำประเภทอื่น ๆ ที่ให้หรือรับรองโดย TradingView อ่านเพิ่มเติมใน ข้อกำหนดการใช้งาน
สคริปต์โอเพนซอร์ซ
ด้วยเจตนารมณ์หลักของ TradingView ผู้สร้างสคริปต์นี้ได้ทำให้เป็นโอเพนซอร์ส เพื่อให้เทรดเดอร์สามารถตรวจสอบและยืนยันฟังก์ชันการทำงานของมันได้ ขอชื่นชมผู้เขียน! แม้ว่าคุณจะใช้งานได้ฟรี แต่โปรดจำไว้ว่าการเผยแพร่โค้ดซ้ำจะต้องเป็นไปตาม กฎระเบียบการใช้งาน ของเรา
คำจำกัดสิทธิ์ความรับผิดชอบ
ข้อมูลและบทความไม่ได้มีวัตถุประสงค์เพื่อก่อให้เกิดกิจกรรมทางการเงิน, การลงทุน, การซื้อขาย, ข้อเสนอแนะ หรือคำแนะนำประเภทอื่น ๆ ที่ให้หรือรับรองโดย TradingView อ่านเพิ่มเติมใน ข้อกำหนดการใช้งาน