MSNR Bias HTF
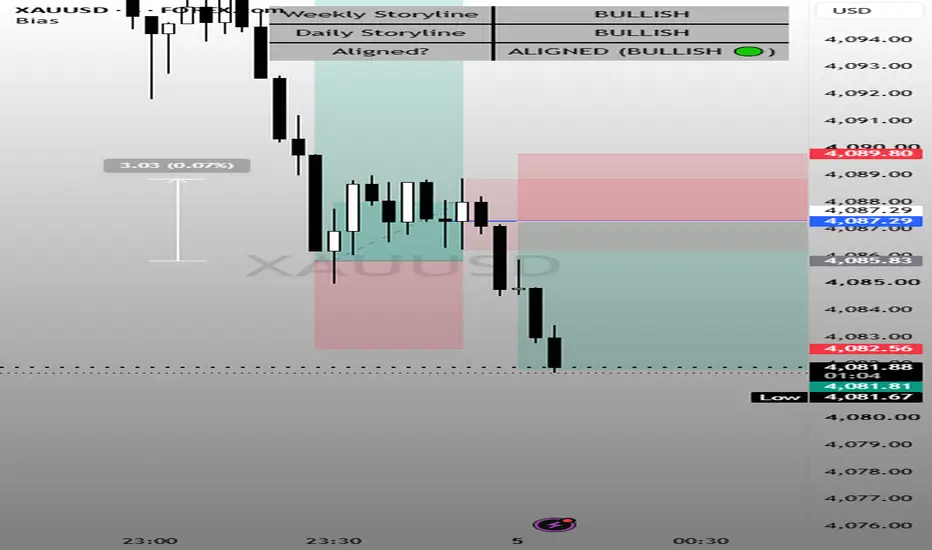
AKFX Storyline Alignment Dashboard (Multi-Timeframe Analysis)
The AKFX Storyline Alignment Dashboard is a multi-timeframe analysis tool designed to help traders quickly determine market bias and alignment across higher and lower timeframes using the concept of Market Storylines.
Instead of trading off single-timeframe signals, this indicator evaluates structural price action on higher timeframes (HTF) and confirms directional continuation via line-chart breakouts on the lower timeframe (LTF).
🟢 How the Storyline Logic Works
A Storyline is defined as the price movement initiated when price interacts with a higher timeframe zone and receives confirmation from the timeframe directly below it.
Weekly Storyline (Macro Bias):
Checks if Current Market Price (CMP) is reacting at a Weekly Support or Resistance zone.
Confirmed when a Daily line-chart breakout occurs (a Daily candle body closes past the local Daily swing high/low).
Daily Storyline (Intermediate Bias):
Checks if CMP is reacting at a Daily Support or Resistance zone.
Confirmed when a 4-Hour (H4) line-chart breakout occurs (an H4 candle body closes past the local H4 swing high/low).
Bias Alignment Status:
ALIGNED (BULLISH 🟢): Both Weekly and Daily storylines are confirmed Bullish. High-probability environment to look for Buy setups.
ALIGNED (BEARISH 🔴): Both Weekly and Daily storylines are confirmed Bearish. High-probability environment to look for Sell setups.
CONFLICTED 🔴: Weekly and Daily storylines point in opposite directions. Exercise caution or wait for alignment.
WAITING FOR SETUP ⚪: One or both storylines are in a neutral/unconfirmed state.
🎨 Key Customization Features
Customizable Dashboard Colors: Configure background fill, text, border, and header colors via the indicator settings.
Default High-Contrast Theme: Pre-styled with a dark gray fill, crisp black text, and a solid black border for maximum readability on any chart background.
Optional Status Highlighting: Includes a toggle (Use Green/Red Status Colors instead of Solid Gray) to instantly highlight alignment with green/red status boxes.
💡 How to Use in Your Trading Strategy
Add the dashboard to your preferred asset (Forex, Crypto, Indices, Stocks).
Check the Bias Alignment Status row:
When ALIGNED: Look for pullback entries at fresh Support/Resistance zones on your execution timeframe (e.g., H1 or 15m) in the direction of the alignment.
When CONFLICTED or WAITING: Sit on your hands or restrict trades to quick scalps, as higher timeframe momentum is divided.
The AKFX Storyline Alignment Dashboard is a multi-timeframe analysis tool designed to help traders quickly determine market bias and alignment across higher and lower timeframes using the concept of Market Storylines.
Instead of trading off single-timeframe signals, this indicator evaluates structural price action on higher timeframes (HTF) and confirms directional continuation via line-chart breakouts on the lower timeframe (LTF).
🟢 How the Storyline Logic Works
A Storyline is defined as the price movement initiated when price interacts with a higher timeframe zone and receives confirmation from the timeframe directly below it.
Weekly Storyline (Macro Bias):
Checks if Current Market Price (CMP) is reacting at a Weekly Support or Resistance zone.
Confirmed when a Daily line-chart breakout occurs (a Daily candle body closes past the local Daily swing high/low).
Daily Storyline (Intermediate Bias):
Checks if CMP is reacting at a Daily Support or Resistance zone.
Confirmed when a 4-Hour (H4) line-chart breakout occurs (an H4 candle body closes past the local H4 swing high/low).
Bias Alignment Status:
ALIGNED (BULLISH 🟢): Both Weekly and Daily storylines are confirmed Bullish. High-probability environment to look for Buy setups.
ALIGNED (BEARISH 🔴): Both Weekly and Daily storylines are confirmed Bearish. High-probability environment to look for Sell setups.
CONFLICTED 🔴: Weekly and Daily storylines point in opposite directions. Exercise caution or wait for alignment.
WAITING FOR SETUP ⚪: One or both storylines are in a neutral/unconfirmed state.
🎨 Key Customization Features
Customizable Dashboard Colors: Configure background fill, text, border, and header colors via the indicator settings.
Default High-Contrast Theme: Pre-styled with a dark gray fill, crisp black text, and a solid black border for maximum readability on any chart background.
Optional Status Highlighting: Includes a toggle (Use Green/Red Status Colors instead of Solid Gray) to instantly highlight alignment with green/red status boxes.
💡 How to Use in Your Trading Strategy
Add the dashboard to your preferred asset (Forex, Crypto, Indices, Stocks).
Check the Bias Alignment Status row:
When ALIGNED: Look for pullback entries at fresh Support/Resistance zones on your execution timeframe (e.g., H1 or 15m) in the direction of the alignment.
When CONFLICTED or WAITING: Sit on your hands or restrict trades to quick scalps, as higher timeframe momentum is divided.

คำจำกัดสิทธิ์ความรับผิดชอบ
ข้อมูลและบทความไม่ได้มีวัตถุประสงค์เพื่อก่อให้เกิดกิจกรรมทางการเงิน, การลงทุน, การซื้อขาย, ข้อเสนอแนะ หรือคำแนะนำประเภทอื่น ๆ ที่ให้หรือรับรองโดย TradingView อ่านเพิ่มเติมใน ข้อกำหนดการใช้งาน
คำจำกัดสิทธิ์ความรับผิดชอบ
ข้อมูลและบทความไม่ได้มีวัตถุประสงค์เพื่อก่อให้เกิดกิจกรรมทางการเงิน, การลงทุน, การซื้อขาย, ข้อเสนอแนะ หรือคำแนะนำประเภทอื่น ๆ ที่ให้หรือรับรองโดย TradingView อ่านเพิ่มเติมใน ข้อกำหนดการใช้งาน