OPEN-SOURCE SCRIPT
Rolling Trendline [LuxAlgo]
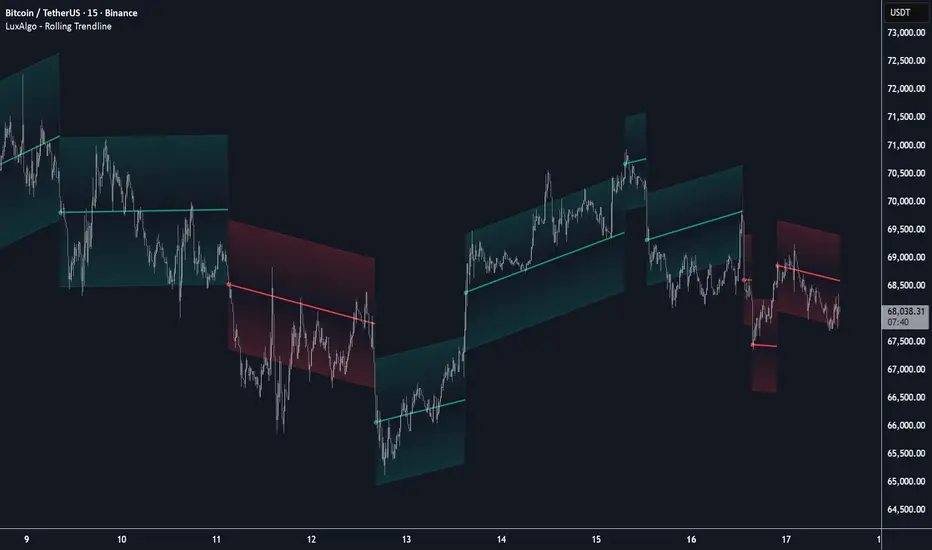
The Rolling Trendline indicator provides a dynamic, self-adjusting trendline that tracks price action using linear regression slope projections and automatically resets when price deviates beyond a specific threshold.
🔶 USAGE
The indicator is designed to provide a continuous trend bias without the "lag" often associated with static linear regression lines. It projects a line forward based on a calculated slope and only shifts its trajectory when the market demonstrates a significant change in momentum.
The addition of ATR-based volatility zones allows traders to visualize a range of expected price action around the projected trend, providing a buffer that accounts for market volatility at the time of each trend reset.
🔹 Interpreting the Line and Zones
🔶 DETAILS
The indicator follows a specific logic flow to maintain its "Rolling" characteristic:
1. Slope Calculation: It calculates the Linear Regression slope over a user-defined lookback period. This slope represents the average rate of change in price.
2. Projection: On every new bar, the indicator projects the next value of the trendline by adding the active slope to the previous trendline value.
3. Deviation Check: The indicator calculates a Standard Deviation threshold. If the distance between the current price and the projected trendline value exceeds this threshold, a reset is triggered.
4. Re-Anchoring: Upon a reset, the trendline "rolls" to the current price and adopts the most recent linear regression slope. Simultaneously, it captures the current ATR to set the width of the new trend zones.
🔶 SETTINGS
🔹 Trend Settings
🔹 ATR Zones
🔹 Visuals
🔶 USAGE
The indicator is designed to provide a continuous trend bias without the "lag" often associated with static linear regression lines. It projects a line forward based on a calculated slope and only shifts its trajectory when the market demonstrates a significant change in momentum.
The addition of ATR-based volatility zones allows traders to visualize a range of expected price action around the projected trend, providing a buffer that accounts for market volatility at the time of each trend reset.
🔹 Interpreting the Line and Zones
- Bullish Phase (Green): Indicates an upward-sloping trajectory. The trendline and its surrounding ATR zones will be colored green, suggesting a bullish bias.
- Bearish Phase (Red): Indicates a downward-sloping trajectory. The trendline and its surrounding ATR zones will be colored red, suggesting a bearish bias.
- ATR Zones: These shaded areas represent a volatility-adjusted range. As long as price remains within the deviation threshold, the zones follow the trendline's trajectory.
- Reset Points: Visualized by a small circle and a break in the line, these occur when price moves too far from the projection. At this moment, the indicator re-anchors to the current price and recalculates both the slope and the ATR zone width.
🔶 DETAILS
The indicator follows a specific logic flow to maintain its "Rolling" characteristic:
1. Slope Calculation: It calculates the Linear Regression slope over a user-defined lookback period. This slope represents the average rate of change in price.
2. Projection: On every new bar, the indicator projects the next value of the trendline by adding the active slope to the previous trendline value.
3. Deviation Check: The indicator calculates a Standard Deviation threshold. If the distance between the current price and the projected trendline value exceeds this threshold, a reset is triggered.
4. Re-Anchoring: Upon a reset, the trendline "rolls" to the current price and adopts the most recent linear regression slope. Simultaneously, it captures the current ATR to set the width of the new trend zones.
🔶 SETTINGS
🔹 Trend Settings
- Slope Lookback: The period used to calculate the linear regression slope. Higher values result in a slope that considers more historical data.
- Deviation Multiplier: Determines how far price can deviate from the trendline before a reset occurs.
- Slope Divisor: This setting allows you to tame the trajectory of the line. Higher values divide the captured slope, resulting in flatter trendlines.
- Source: The price data used for all calculations (default is Close).
🔹 ATR Zones
- ATR Length: The lookback period used for the Average True Range calculation, which determines the width of the volatility bands.
- ATR Multiplier: Controls the width of the shaded zones around the trendline.
🔹 Visuals
- Bullish/Bearish Trend Colors: Customizes the colors for the trendline and zones based on the slope direction.
- Zone Color: Sets the base color for the ATR area fills.
- Line Width: Adjusts the thickness of the primary rolling trendline.
สคริปต์แบบโอเพนซอร์ส
ด้วยเจตนารมณ์หลักของ TradingView ผู้สร้างสคริปต์นี้ได้ทำให้เป็นโอเพนซอร์ส เพื่อให้เทรดเดอร์สามารถตรวจสอบและยืนยันฟังก์ชันการทำงานของมันได้ ขอชื่นชมผู้เขียน! แม้ว่าคุณจะใช้งานได้ฟรี แต่โปรดจำไว้ว่าการเผยแพร่โค้ดซ้ำจะต้องเป็นไปตาม กฎระเบียบการใช้งาน ของเรา

All content & scripts provided by LuxAlgo are for educational purposes only and are not financial advice.
คำจำกัดสิทธิ์ความรับผิดชอบ
ข้อมูลและบทความไม่ได้มีวัตถุประสงค์เพื่อก่อให้เกิดกิจกรรมทางการเงิน, การลงทุน, การซื้อขาย, ข้อเสนอแนะ หรือคำแนะนำประเภทอื่น ๆ ที่ให้หรือรับรองโดย TradingView อ่านเพิ่มเติมใน ข้อกำหนดการใช้งาน
สคริปต์แบบโอเพนซอร์ส
ด้วยเจตนารมณ์หลักของ TradingView ผู้สร้างสคริปต์นี้ได้ทำให้เป็นโอเพนซอร์ส เพื่อให้เทรดเดอร์สามารถตรวจสอบและยืนยันฟังก์ชันการทำงานของมันได้ ขอชื่นชมผู้เขียน! แม้ว่าคุณจะใช้งานได้ฟรี แต่โปรดจำไว้ว่าการเผยแพร่โค้ดซ้ำจะต้องเป็นไปตาม กฎระเบียบการใช้งาน ของเรา
คำจำกัดสิทธิ์ความรับผิดชอบ
ข้อมูลและบทความไม่ได้มีวัตถุประสงค์เพื่อก่อให้เกิดกิจกรรมทางการเงิน, การลงทุน, การซื้อขาย, ข้อเสนอแนะ หรือคำแนะนำประเภทอื่น ๆ ที่ให้หรือรับรองโดย TradingView อ่านเพิ่มเติมใน ข้อกำหนดการใช้งาน