OPEN-SOURCE SCRIPT
NQ8020-GC0802
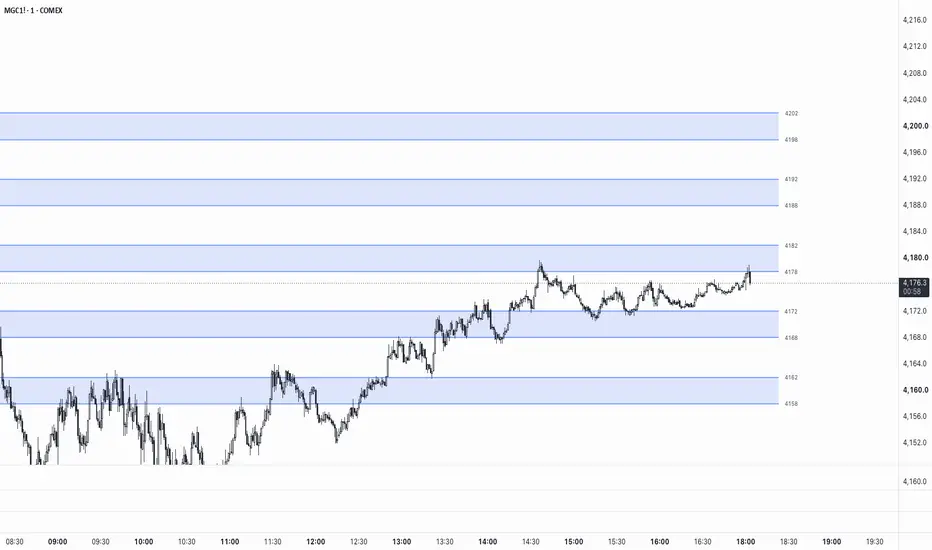
Round-Level Zones — Auto NQ/GC Support & Resistance Map
This indicator automatically maps out horizontal reaction zones around round-number price levels for Nasdaq (NQ/MNQ) and Gold (GC/MGC) futures, adjusting its logic to match the instrument you're viewing.
How it works
The script detects the symbol you're on and applies the appropriate round-level structure:
Zones re-center automatically as price moves, giving you a consistent, always-current map of nearby round-number levels without manually drawing lines on each instrument.
Features
Why round numbers matter
Round price levels tend to attract order flow — stops, limit orders, and psychological decision points cluster around them. Having these zones pre-mapped can help with spotting potential reaction areas, planning entries/exits, or keeping round-number context visible without cluttering the chart with manual drawings.
Usage notes
Designed specifically for the round-number structures of NQ/MNQ (hundreds) and GC/MGC (tens). This is a visual reference tool only and does not generate buy/sell signals — always combine with your own strategy, market structure analysis, and risk management.
This indicator automatically maps out horizontal reaction zones around round-number price levels for Nasdaq (NQ/MNQ) and Gold (GC/MGC) futures, adjusting its logic to match the instrument you're viewing.
How it works
The script detects the symbol you're on and applies the appropriate round-level structure:
- NQ / MNQ → zones are drawn from xx80 to xx20 around each round hundred (e.g. a zone at the 24,000 level runs from 24,020 down to 23,980)
- GC / MGC → zones are drawn from xx8 to xx2 around each round ten (e.g. a zone at 3350 runs from 3352 down to 3348)
Zones re-center automatically as price moves, giving you a consistent, always-current map of nearby round-number levels without manually drawing lines on each instrument.
Features
- Works on both NQ/MNQ and GC/MGC — no separate indicators or settings to switch
- Adjustable number of zones displayed above/below price (1–50)
- Customizable zone fill color, border line color, style (solid/dashed/dotted), and width
- Optional price labels on each zone boundary
- Adjustable right-side offset and left-extension of lines
- On-chart warning if applied to an unsupported symbol
Why round numbers matter
Round price levels tend to attract order flow — stops, limit orders, and psychological decision points cluster around them. Having these zones pre-mapped can help with spotting potential reaction areas, planning entries/exits, or keeping round-number context visible without cluttering the chart with manual drawings.
Usage notes
Designed specifically for the round-number structures of NQ/MNQ (hundreds) and GC/MGC (tens). This is a visual reference tool only and does not generate buy/sell signals — always combine with your own strategy, market structure analysis, and risk management.
สคริปต์แบบโอเพนซอร์ส
ด้วยเจตนารมณ์หลักของ TradingView ผู้สร้างสคริปต์นี้ได้ทำให้เป็นโอเพนซอร์ส เพื่อให้เทรดเดอร์สามารถตรวจสอบและยืนยันฟังก์ชันการทำงานของมันได้ ขอชื่นชมผู้เขียน! แม้ว่าคุณจะใช้งานได้ฟรี แต่โปรดจำไว้ว่าการเผยแพร่โค้ดซ้ำจะต้องเป็นไปตาม กฎระเบียบการใช้งาน ของเรา

คำจำกัดสิทธิ์ความรับผิดชอบ
ข้อมูลและบทความไม่ได้มีวัตถุประสงค์เพื่อก่อให้เกิดกิจกรรมทางการเงิน, การลงทุน, การซื้อขาย, ข้อเสนอแนะ หรือคำแนะนำประเภทอื่น ๆ ที่ให้หรือรับรองโดย TradingView อ่านเพิ่มเติมใน ข้อกำหนดการใช้งาน
สคริปต์แบบโอเพนซอร์ส
ด้วยเจตนารมณ์หลักของ TradingView ผู้สร้างสคริปต์นี้ได้ทำให้เป็นโอเพนซอร์ส เพื่อให้เทรดเดอร์สามารถตรวจสอบและยืนยันฟังก์ชันการทำงานของมันได้ ขอชื่นชมผู้เขียน! แม้ว่าคุณจะใช้งานได้ฟรี แต่โปรดจำไว้ว่าการเผยแพร่โค้ดซ้ำจะต้องเป็นไปตาม กฎระเบียบการใช้งาน ของเรา
คำจำกัดสิทธิ์ความรับผิดชอบ
ข้อมูลและบทความไม่ได้มีวัตถุประสงค์เพื่อก่อให้เกิดกิจกรรมทางการเงิน, การลงทุน, การซื้อขาย, ข้อเสนอแนะ หรือคำแนะนำประเภทอื่น ๆ ที่ให้หรือรับรองโดย TradingView อ่านเพิ่มเติมใน ข้อกำหนดการใช้งาน