OPEN-SOURCE SCRIPT
Coil & Fire - Ashish
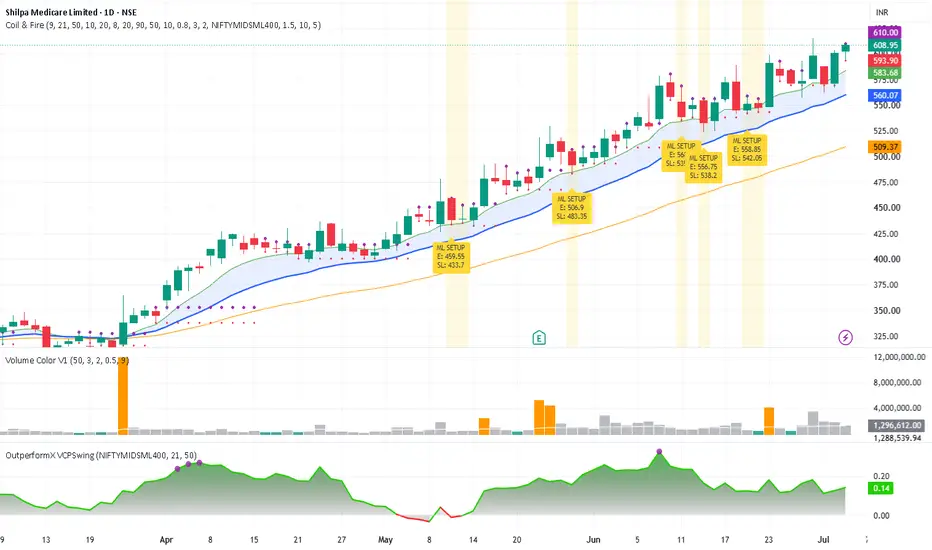
*Updated version of Momentum Scanner*
Finds stocks that had a strong explosive move (EP candle), are now coiling quietly near their EMAs, and marks the exact entry and stop-loss levels based on the most recent low-volume healthy-dip candle.
How it works:
Screens for stocks with a recent 8%+ single-day move that are outperforming their benchmark since that move, holding above the EMA9/21 cloud with the trend structure intact, and showing genuinely quiet volume on the pullback. When all conditions align, it marks a teal bar — a low-volume healthy-dip candle sitting within 5% above EMA9. The high of that bar is your entry. The low is your stop-loss. Purple dots show the entry level. Red dots show the stop.
Orange background = price has crossed the entry level. Yellow background = setup is valid, waiting for the trigger.
What's different from Momentum Scanner:
Entry and stop-loss are now anchored to the most recent teal bar rather than a historical coil-high level, so levels are always close to current price. Volume comparison for the teal bar now uses a 10-day average instead of 50-day, making it more responsive to recent trading activity rather than a long historical baseline.
Note: Indicators are tools, not oracles — every signal still requires human judgment, risk management, and context before any trade is taken.
Finds stocks that had a strong explosive move (EP candle), are now coiling quietly near their EMAs, and marks the exact entry and stop-loss levels based on the most recent low-volume healthy-dip candle.
How it works:
Screens for stocks with a recent 8%+ single-day move that are outperforming their benchmark since that move, holding above the EMA9/21 cloud with the trend structure intact, and showing genuinely quiet volume on the pullback. When all conditions align, it marks a teal bar — a low-volume healthy-dip candle sitting within 5% above EMA9. The high of that bar is your entry. The low is your stop-loss. Purple dots show the entry level. Red dots show the stop.
Orange background = price has crossed the entry level. Yellow background = setup is valid, waiting for the trigger.
What's different from Momentum Scanner:
Entry and stop-loss are now anchored to the most recent teal bar rather than a historical coil-high level, so levels are always close to current price. Volume comparison for the teal bar now uses a 10-day average instead of 50-day, making it more responsive to recent trading activity rather than a long historical baseline.
Note: Indicators are tools, not oracles — every signal still requires human judgment, risk management, and context before any trade is taken.
สคริปต์แบบโอเพนซอร์ส
ด้วยเจตนารมณ์หลักของ TradingView ผู้สร้างสคริปต์นี้ได้ทำให้เป็นโอเพนซอร์ส เพื่อให้เทรดเดอร์สามารถตรวจสอบและยืนยันฟังก์ชันการทำงานของมันได้ ขอชื่นชมผู้เขียน! แม้ว่าคุณจะใช้งานได้ฟรี แต่โปรดจำไว้ว่าการเผยแพร่โค้ดซ้ำจะต้องเป็นไปตาม กฎระเบียบการใช้งาน ของเรา

คำจำกัดสิทธิ์ความรับผิดชอบ
ข้อมูลและบทความไม่ได้มีวัตถุประสงค์เพื่อก่อให้เกิดกิจกรรมทางการเงิน, การลงทุน, การซื้อขาย, ข้อเสนอแนะ หรือคำแนะนำประเภทอื่น ๆ ที่ให้หรือรับรองโดย TradingView อ่านเพิ่มเติมใน ข้อกำหนดการใช้งาน
สคริปต์แบบโอเพนซอร์ส
ด้วยเจตนารมณ์หลักของ TradingView ผู้สร้างสคริปต์นี้ได้ทำให้เป็นโอเพนซอร์ส เพื่อให้เทรดเดอร์สามารถตรวจสอบและยืนยันฟังก์ชันการทำงานของมันได้ ขอชื่นชมผู้เขียน! แม้ว่าคุณจะใช้งานได้ฟรี แต่โปรดจำไว้ว่าการเผยแพร่โค้ดซ้ำจะต้องเป็นไปตาม กฎระเบียบการใช้งาน ของเรา
คำจำกัดสิทธิ์ความรับผิดชอบ
ข้อมูลและบทความไม่ได้มีวัตถุประสงค์เพื่อก่อให้เกิดกิจกรรมทางการเงิน, การลงทุน, การซื้อขาย, ข้อเสนอแนะ หรือคำแนะนำประเภทอื่น ๆ ที่ให้หรือรับรองโดย TradingView อ่านเพิ่มเติมใน ข้อกำหนดการใช้งาน