RCS Sessions UTC+2 Winter Time
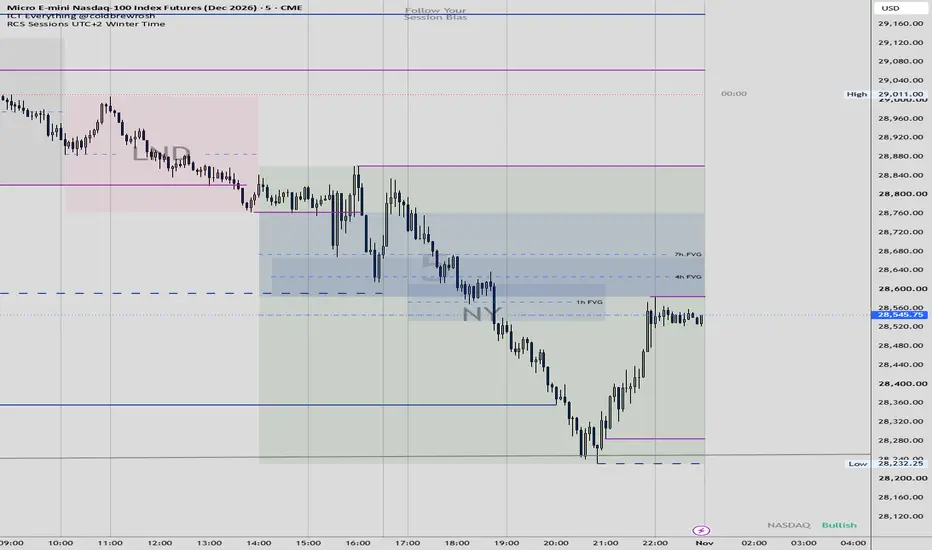
# RCS Sessions UTC+2 Winter Time
**Institutional Timing & Session Execution Framework**
RCS Sessions UTC+2 Winter Time is a custom TradingView indicator developed by **Raul Cristian Sararu**, founder of RCS Execution, to visualize key institutional trading hours, session transitions, and execution windows.
Designed primarily for NASDAQ futures trading, the indicator automatically displays 16 vertical timing references throughout the trading day, including Sydney, Asian, London, and New York sessions, 4-hour and 7-hour candle prints, news windows, and institutional delivery periods.
## Key Features
- **Full-Day Mapping:** Displays all timing references in advance, allowing traders to prepare before each session begins.
- **Historical References:** Displays the current day and up to 20 previous days, with seven days selected by default.
- **Institutional Timing:** Highlights 4H and 7H candle prints, major session transitions, and potential execution windows.
- **Winter Time Configuration:** Optimized for Bucharest UTC+2, with customizable timezone settings.
- **Customizable Appearance:** Adjustable vertical line styles, colors, thickness, labels, and individual visibility controls.
- **Clean Chart Integration:** Minimalist dotted vertical lines designed to support technical analysis without unnecessary visual clutter.
## How to Use the Indicator
**1. Add the indicator to your chart**
Apply RCS Sessions UTC+2 Winter Time to your TradingView chart. The indicator is designed primarily for NASDAQ futures (NQ/MNQ), particularly on intraday timeframes.
**2. Configure your timezone**
Select GMT+2 for the fixed Bucharest winter-time framework. The indicator plots its reference lines according to the selected timezone.
**3. Identify key trading sessions**
Use the vertical lines to recognize session openings, closings, and transitions:
- Sydney: 22:00–07:00
- Asia/Tokyo: 02:00–11:00
- London: 10:00–19:00
- New York: 15:00–00:00
All times follow the configured UTC+2 framework.
**4. Monitor institutional candle prints**
Pay particular attention to the 4H and 7H reference times.
- 4H Prints: 09:00, 13:00, 17:00, 21:00
- 7H Prints: 08:00, 15:00, 22:00
Observe how price reacts around these timing references. Look for acceptance, rejection, liquidity sweeps, expansion, or potential reversals.
**5. Prepare for New York execution**
Monitor the 07:00 New York Midnight reference, followed by the 15:00 institutional session marker and the 15:30, 16:00, and 16:30 news and opening windows.
These references help organize preparation for potential New York session delivery. Check the actual economic calendar and U.S. market schedule, particularly during daylight-saving transition periods.
**6. Combine timing with price confirmation**
The indicator does not determine market direction or generate automatic entries.
Use it alongside market structure, liquidity levels, session highs and lows, and price action confirmation. The RCS Execution framework emphasizes 5-minute triggers supported by higher-timeframe structure and acceptance.
**7. Review previous trading days**
Use the historical vertical lines to study how price behaved around institutional timing references. Compare session reactions, liquidity sweeps, continuation patterns, and reversals to improve preparation and execution discipline.
## Trading Philosophy
**The session defines the context. The vertical timing line defines when to pay attention. Price action and confirmation determine execution.**
Timing alone is not an entry signal. Successful execution requires patience, market context, disciplined risk management, and confirmation.
Developed as part of the **RCS Execution Institutional Execution Framework**.
**Trade the system - not the emotion.**
© Raul Cristian Sararu | RCS Execution
**Institutional Timing & Session Execution Framework**
RCS Sessions UTC+2 Winter Time is a custom TradingView indicator developed by **Raul Cristian Sararu**, founder of RCS Execution, to visualize key institutional trading hours, session transitions, and execution windows.
Designed primarily for NASDAQ futures trading, the indicator automatically displays 16 vertical timing references throughout the trading day, including Sydney, Asian, London, and New York sessions, 4-hour and 7-hour candle prints, news windows, and institutional delivery periods.
## Key Features
- **Full-Day Mapping:** Displays all timing references in advance, allowing traders to prepare before each session begins.
- **Historical References:** Displays the current day and up to 20 previous days, with seven days selected by default.
- **Institutional Timing:** Highlights 4H and 7H candle prints, major session transitions, and potential execution windows.
- **Winter Time Configuration:** Optimized for Bucharest UTC+2, with customizable timezone settings.
- **Customizable Appearance:** Adjustable vertical line styles, colors, thickness, labels, and individual visibility controls.
- **Clean Chart Integration:** Minimalist dotted vertical lines designed to support technical analysis without unnecessary visual clutter.
## How to Use the Indicator
**1. Add the indicator to your chart**
Apply RCS Sessions UTC+2 Winter Time to your TradingView chart. The indicator is designed primarily for NASDAQ futures (NQ/MNQ), particularly on intraday timeframes.
**2. Configure your timezone**
Select GMT+2 for the fixed Bucharest winter-time framework. The indicator plots its reference lines according to the selected timezone.
**3. Identify key trading sessions**
Use the vertical lines to recognize session openings, closings, and transitions:
- Sydney: 22:00–07:00
- Asia/Tokyo: 02:00–11:00
- London: 10:00–19:00
- New York: 15:00–00:00
All times follow the configured UTC+2 framework.
**4. Monitor institutional candle prints**
Pay particular attention to the 4H and 7H reference times.
- 4H Prints: 09:00, 13:00, 17:00, 21:00
- 7H Prints: 08:00, 15:00, 22:00
Observe how price reacts around these timing references. Look for acceptance, rejection, liquidity sweeps, expansion, or potential reversals.
**5. Prepare for New York execution**
Monitor the 07:00 New York Midnight reference, followed by the 15:00 institutional session marker and the 15:30, 16:00, and 16:30 news and opening windows.
These references help organize preparation for potential New York session delivery. Check the actual economic calendar and U.S. market schedule, particularly during daylight-saving transition periods.
**6. Combine timing with price confirmation**
The indicator does not determine market direction or generate automatic entries.
Use it alongside market structure, liquidity levels, session highs and lows, and price action confirmation. The RCS Execution framework emphasizes 5-minute triggers supported by higher-timeframe structure and acceptance.
**7. Review previous trading days**
Use the historical vertical lines to study how price behaved around institutional timing references. Compare session reactions, liquidity sweeps, continuation patterns, and reversals to improve preparation and execution discipline.
## Trading Philosophy
**The session defines the context. The vertical timing line defines when to pay attention. Price action and confirmation determine execution.**
Timing alone is not an entry signal. Successful execution requires patience, market context, disciplined risk management, and confirmation.
Developed as part of the **RCS Execution Institutional Execution Framework**.
**Trade the system - not the emotion.**
© Raul Cristian Sararu | RCS Execution

คำจำกัดสิทธิ์ความรับผิดชอบ
ข้อมูลและบทความไม่ได้มีวัตถุประสงค์เพื่อก่อให้เกิดกิจกรรมทางการเงิน, การลงทุน, การซื้อขาย, ข้อเสนอแนะ หรือคำแนะนำประเภทอื่น ๆ ที่ให้หรือรับรองโดย TradingView อ่านเพิ่มเติมใน ข้อกำหนดการใช้งาน
คำจำกัดสิทธิ์ความรับผิดชอบ
ข้อมูลและบทความไม่ได้มีวัตถุประสงค์เพื่อก่อให้เกิดกิจกรรมทางการเงิน, การลงทุน, การซื้อขาย, ข้อเสนอแนะ หรือคำแนะนำประเภทอื่น ๆ ที่ให้หรือรับรองโดย TradingView อ่านเพิ่มเติมใน ข้อกำหนดการใช้งาน