ที่อัปเดต:
Footprint: Cluster by Exchanges v2 [AlexKo]
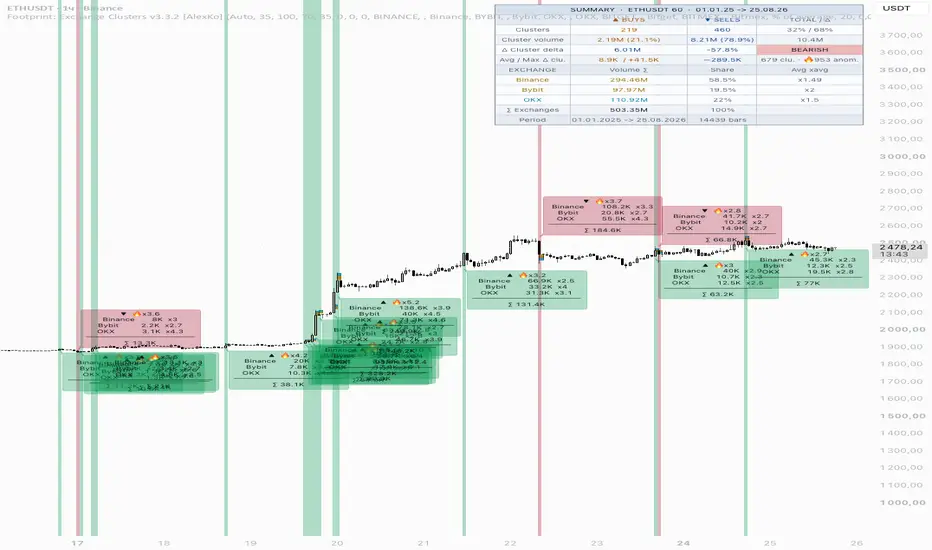
Footprint: Cluster by Exchanges v2
What the Indicator Does
Detects buy and sell clusters from footprint data (POC level + delta) and draws a **stacked set of colored boxes** at each cluster — one box per connected exchange. Box height is proportional to that exchange's volume relative to its own average, so you can instantly see **which exchanges participated in forming the cluster**.
How It Works
1. Cluster Detection
A cluster is confirmed on bar close when all of the following conditions pass:
| Condition | Buy Cluster | Sell Cluster |
|-----------|-------------|--------------|
| POC position | ≤ N% from candle bottom | ≥ (100−N)% from bottom |
| Delta (optional) | > 0 | < 0 |
| Min delta % | ≥ threshold | ≥ threshold |
| Min candle volume | ≥ threshold | ≥ threshold |
| Min range (ATR %) | ≥ threshold | ≥ threshold |
2. Fetching Exchange Volumes
Once a cluster is detected, volume is pulled from each enabled exchange via `request.security()`, automatically substituting the current chart ticker.
3. Visualization — Stacked Boxes
```
▲ ← label (hover → tooltip with full details)
┌──────────┐
│ OKX │ ← h = ATR × scale × (vol_okx / avg_okx)
├──────────┤
│ Bybit │ ← height reflects relative volume
├──────────┤
│ Binance │ ← bottom box = Exchange 1 in settings
● ← POC level of the cluster candle
```
Buy cluster** → stack grows **upward** from POC
Sell cluster** → stack grows **downward** from POC
- Each box is labeled with the exchange name
- Hovering the ▲/▼ marker shows the full tooltip
---
Tooltip (example)
```
▲ BUY CLUSTER
─────────────────────────
POC: 65 420.00 (18% from bottom)
Delta: +12 450 (+8.3%)
Buy: 54.2% │ Sell: 45.8%
─────────────────────────
Exchange Volume ×avg
─────────────────────────
Binance 1.2M ×2.3
Bybit 890K ×1.8
OKX 450K ×0.9
─────────────────────────
∑ Total: 2.5M
```
---
Parameters
Footprint Parameters
| Parameter | Default | Description |
|-----------|---------|-------------|
| Ticks per Row | 100 | Footprint row size in ticks |
| Value Area (%) | 70 | Value area percentage for POC calculation |
Clusters
| Parameter | Default | Description |
|-----------|---------|-------------|
| Cluster Zone (%) | 35 | POC in bottom/top N% of range = cluster. Recommended: 30–40% |
| Show Buy / Sell Clusters | true / true | Toggle each cluster type on/off |
| Accent Color: Buys / Sells | orange / blue | Color for the ▲/▼ label and frame |
Filters
| Parameter | Default | Description |
|-----------|---------|-------------|
| Confirm with Delta | true | Main filter. Buy cluster only when delta > 0 |
| Min Delta (% of Volume) | 0 | Minimum delta strength as % of volume. 0 = disabled |
| Min Candle Volume | 0 | Ignore low-activity bars. 0 = disabled |
| Min Candle Range (ATR %) | 0 | Doji filter. 0 = disabled |
Exchanges 1–5
| Parameter | Description |
|-----------|-------------|
| Enable | Toggle this exchange on/off |
| Prefix | TradingView exchange prefix: `BINANCE`, `BYBIT`, `OKX`, `BITGET`, `KRAKEN`, `COINBASE`, `BITMEX`, etc. |
| Ticker | Empty = current chart ticker. Fill manually if the exchange uses a different format (e.g. `XBTUSD` for Kraken) |
| Name | Text shown on boxes and in the tooltip |
| Color | Box fill and border color |
Bar Visualization
| Parameter | Default | Description |
|-----------|---------|-------------|
| Normalization Mode | % of Average | How bar heights are calculated (see below) |
| SMA Period (bars) | 20 | Moving average period for normalization. Volume / SMA = relative size |
| Height Scale (× ATR) | 0.08 | Base height when volume equals average. Increase if bars look too small |
| Max Multiplier | 5.0 | Growth cap. Volume > 5×average does not increase height further |
| Fill Transparency | 25 | 0 = fully opaque, 95 = nearly invisible |
| Info Label (exchanges + volumes) | true | Show per-exchange volume label outside the candle |
| Label Text Size | small | Text size for the label: tiny / small / normal |
| Label Offset (× ATR) | 0.5 | Distance from candle high/low in ATR units. 0 = flush with candle |
Normalization Modes
| Mode | Description |
|------|-------------|
| **% of Average** | Each exchange bar is scaled against its own SMA. Height = base when volume = average; capped at Max Multiplier × base |
| **% of Total** | Bar width represents the exchange's share of combined volume across all active exchanges on that bar |
| **Absolute** | All exchanges normalized against the combined average of all active exchanges |
Limitations
Object limit:** `max_boxes_count = 500`. With 3 active exchanges you can see ~165 cluster bars; with 5 exchanges ~100. Older objects are removed automatically.
Footprint data:** requires a TradingView subscription that includes Order Flow / Footprint access.
Box labels:** may not be visible if a box is very thin (small ATR or low scale). The hover tooltip always works.
Cluster detection** is based on the current chart's exchange only. Exchanges 1–5 provide volume breakdowns but do not affect whether a cluster is detected.
Alerts
| Alert Name | Trigger |
|------------|---------|
| Buy Cluster | Buy cluster detected on bar close |
| Sell Cluster | Sell cluster detected on bar close |
Alert message format: `{{ticker}} {{interval}} | Buy/Sell cluster by exchanges`
What the Indicator Does
Detects buy and sell clusters from footprint data (POC level + delta) and draws a **stacked set of colored boxes** at each cluster — one box per connected exchange. Box height is proportional to that exchange's volume relative to its own average, so you can instantly see **which exchanges participated in forming the cluster**.
How It Works
1. Cluster Detection
A cluster is confirmed on bar close when all of the following conditions pass:
| Condition | Buy Cluster | Sell Cluster |
|-----------|-------------|--------------|
| POC position | ≤ N% from candle bottom | ≥ (100−N)% from bottom |
| Delta (optional) | > 0 | < 0 |
| Min delta % | ≥ threshold | ≥ threshold |
| Min candle volume | ≥ threshold | ≥ threshold |
| Min range (ATR %) | ≥ threshold | ≥ threshold |
2. Fetching Exchange Volumes
Once a cluster is detected, volume is pulled from each enabled exchange via `request.security()`, automatically substituting the current chart ticker.
3. Visualization — Stacked Boxes
```
▲ ← label (hover → tooltip with full details)
┌──────────┐
│ OKX │ ← h = ATR × scale × (vol_okx / avg_okx)
├──────────┤
│ Bybit │ ← height reflects relative volume
├──────────┤
│ Binance │ ← bottom box = Exchange 1 in settings
● ← POC level of the cluster candle
```
Buy cluster** → stack grows **upward** from POC
Sell cluster** → stack grows **downward** from POC
- Each box is labeled with the exchange name
- Hovering the ▲/▼ marker shows the full tooltip
---
Tooltip (example)
```
▲ BUY CLUSTER
─────────────────────────
POC: 65 420.00 (18% from bottom)
Delta: +12 450 (+8.3%)
Buy: 54.2% │ Sell: 45.8%
─────────────────────────
Exchange Volume ×avg
─────────────────────────
Binance 1.2M ×2.3
Bybit 890K ×1.8
OKX 450K ×0.9
─────────────────────────
∑ Total: 2.5M
```
---
Parameters
Footprint Parameters
| Parameter | Default | Description |
|-----------|---------|-------------|
| Ticks per Row | 100 | Footprint row size in ticks |
| Value Area (%) | 70 | Value area percentage for POC calculation |
Clusters
| Parameter | Default | Description |
|-----------|---------|-------------|
| Cluster Zone (%) | 35 | POC in bottom/top N% of range = cluster. Recommended: 30–40% |
| Show Buy / Sell Clusters | true / true | Toggle each cluster type on/off |
| Accent Color: Buys / Sells | orange / blue | Color for the ▲/▼ label and frame |
Filters
| Parameter | Default | Description |
|-----------|---------|-------------|
| Confirm with Delta | true | Main filter. Buy cluster only when delta > 0 |
| Min Delta (% of Volume) | 0 | Minimum delta strength as % of volume. 0 = disabled |
| Min Candle Volume | 0 | Ignore low-activity bars. 0 = disabled |
| Min Candle Range (ATR %) | 0 | Doji filter. 0 = disabled |
Exchanges 1–5
| Parameter | Description |
|-----------|-------------|
| Enable | Toggle this exchange on/off |
| Prefix | TradingView exchange prefix: `BINANCE`, `BYBIT`, `OKX`, `BITGET`, `KRAKEN`, `COINBASE`, `BITMEX`, etc. |
| Ticker | Empty = current chart ticker. Fill manually if the exchange uses a different format (e.g. `XBTUSD` for Kraken) |
| Name | Text shown on boxes and in the tooltip |
| Color | Box fill and border color |
Bar Visualization
| Parameter | Default | Description |
|-----------|---------|-------------|
| Normalization Mode | % of Average | How bar heights are calculated (see below) |
| SMA Period (bars) | 20 | Moving average period for normalization. Volume / SMA = relative size |
| Height Scale (× ATR) | 0.08 | Base height when volume equals average. Increase if bars look too small |
| Max Multiplier | 5.0 | Growth cap. Volume > 5×average does not increase height further |
| Fill Transparency | 25 | 0 = fully opaque, 95 = nearly invisible |
| Info Label (exchanges + volumes) | true | Show per-exchange volume label outside the candle |
| Label Text Size | small | Text size for the label: tiny / small / normal |
| Label Offset (× ATR) | 0.5 | Distance from candle high/low in ATR units. 0 = flush with candle |
Normalization Modes
| Mode | Description |
|------|-------------|
| **% of Average** | Each exchange bar is scaled against its own SMA. Height = base when volume = average; capped at Max Multiplier × base |
| **% of Total** | Bar width represents the exchange's share of combined volume across all active exchanges on that bar |
| **Absolute** | All exchanges normalized against the combined average of all active exchanges |
Limitations
Object limit:** `max_boxes_count = 500`. With 3 active exchanges you can see ~165 cluster bars; with 5 exchanges ~100. Older objects are removed automatically.
Footprint data:** requires a TradingView subscription that includes Order Flow / Footprint access.
Box labels:** may not be visible if a box is very thin (small ATR or low scale). The hover tooltip always works.
Cluster detection** is based on the current chart's exchange only. Exchanges 1–5 provide volume breakdowns but do not affect whether a cluster is detected.
Alerts
| Alert Name | Trigger |
|------------|---------|
| Buy Cluster | Buy cluster detected on bar close |
| Sell Cluster | Sell cluster detected on bar close |
Alert message format: `{{ticker}} {{interval}} | Buy/Sell cluster by exchanges`
Release Note
Footprint: Exchange Clusters v3.3.2 [AlexKo]Flags bars whose volume is far above their own recent history and shows, on the same bar, how that volume was split across up to five crypto exchanges. Delta decides the side: delta >= 0 is drawn as a long event in green with the stack growing up from the POC, delta < 0 as a short event in red with the stack growing down.
A bar is flagged when metric >= base x (1 + threshold/100), where the base is the average or the maximum of the last N bars with the current bar excluded, so a huge bar cannot inflate the level it is measured against. A ratio to the rolling window travels between symbols and timeframes unchanged, which a fixed volume threshold does not; summing volume across venues as the default metric keeps a single-exchange print from reading as market-wide activity.
Excess threshold defaults to 150% (current >= base x 2.5), sensible range roughly 100-300; metric can be footprint bar volume, the sum across exchanges or absolute delta. Two detection modes: All bars by volume, or Clusters only, where the POC position inside the bar range classifies absorption and the window holds the last N clusters of the same side. A summary table accumulates counts, cluster delta and per-exchange shares. Alerts: classic conditions for buy/sell clusters and anomalies, plus a JSON payload once per bar close for a bot.
Pine v6, native request.footprint plus one request.security per exchange, no lookahead, everything on confirmed bars, so nothing repaints. Theme setting adapts the table, labels and colours to a light or dark chart. Built for crypto pairs listed on several exchanges; it is a context and confirmation tool, not a standalone entry, and it describes volume that has already traded rather than predicting the next move.
Not financial advice. Test on your own instruments and timeframes.

คำจำกัดสิทธิ์ความรับผิดชอบ
ข้อมูลและบทความไม่ได้มีวัตถุประสงค์เพื่อก่อให้เกิดกิจกรรมทางการเงิน, การลงทุน, การซื้อขาย, ข้อเสนอแนะ หรือคำแนะนำประเภทอื่น ๆ ที่ให้หรือรับรองโดย TradingView อ่านเพิ่มเติมใน ข้อกำหนดการใช้งาน
คำจำกัดสิทธิ์ความรับผิดชอบ
ข้อมูลและบทความไม่ได้มีวัตถุประสงค์เพื่อก่อให้เกิดกิจกรรมทางการเงิน, การลงทุน, การซื้อขาย, ข้อเสนอแนะ หรือคำแนะนำประเภทอื่น ๆ ที่ให้หรือรับรองโดย TradingView อ่านเพิ่มเติมใน ข้อกำหนดการใช้งาน