ที่อัปเดต:
TEStructure PivotSwings Clusters RowProfile
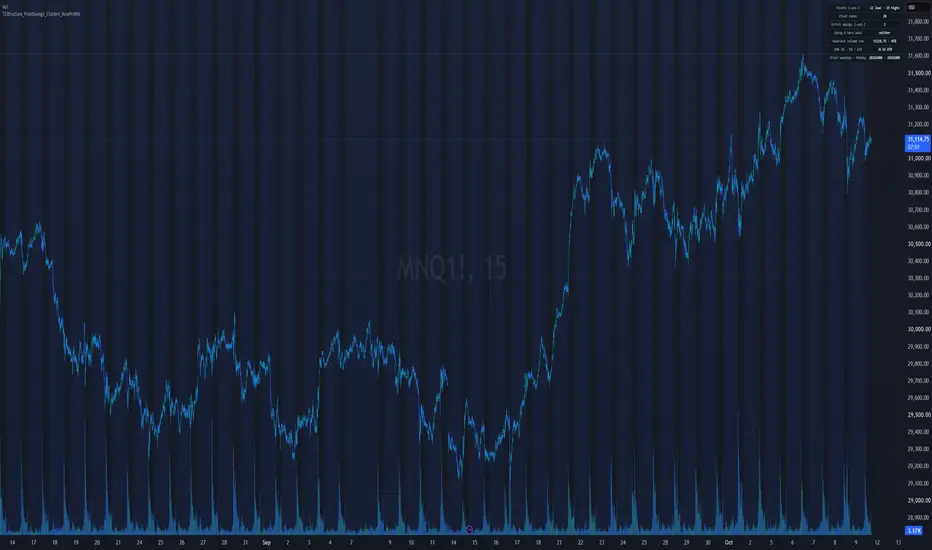
- `pivotSwingsInto(array<float> h, array<float> l, int left, int right, int lowT, int highT, int lowL, int highL, array<float> cP, array<int> cT, array<int> cL, array<int> ts, int dur, int pack = 32)` — writes every pivot low and pivot high of the arrays into three parallel output arrays. Bar i is a pivot low when no bar in [i − left, i + right] has a lower low and at least one other bar there has a higher low (equal lows are allowed; a flat window is not a pivot); a pivot high is the mirror. The low is written before the high for the same bar.
- `strictPivot4At(array<float> hs, array<float> ls, int p, int side)` — whether the value at p is a strict 4-and-4 swing: for side 1 the low at p is strictly below each of the 4 lows on either side, for side −1 the high at p is strictly above each of the 4 highs on either side
- `strictSwing2Prices(array<float> hs, array<float> ls, int lb)` — every strict 2-and-2 swing over the last lb values: a low strictly below the 2 lows on each side, a high strictly above the 2 highs on each side. An na anywhere in the five values of a window kills that window's swings. For each index the low (if any) is written before the high.
- `sessionExtremesInto(array<int> ts, array<float> h, array<float> l, array<float> cP, array<int> cT, array<int> cL, array<int> tys, array<int> lbs, string tz = "America/New_York", int rollMs = 21600000, int rthOpen = 570, int rthClose = 960, int rollMin = 1080, bool useCmeHolidays = true, int pack = 32)` — writes the prior-session extremes of a bar series into three parallel output arrays: the low and high of the newest two COMPLETED regular sessions ("prior" and "two sessions back") and of the newest two out-of-session periods ("overnight" and the one before it). Each bar is keyed to a trading date = its date in tz after adding rollMs; it is in the regular session when its minute of day in tz is in [rthOpen, rthClose) and, when useCmeHolidays is true, its trading date is not in TE Math's CME holiday table. Today's regular session counts as prior only once the last bar's minute is in [rthClose, rollMin). Each extreme's label code carries pack × (its bar's time + 1), the first bar that printed it.
- `dailyLevelsInto(array<float> dH, array<float> dL, int pivotStrength, array<float> cP, array<int> cT, array<int> cL, array<int> tys, array<int> lbs, int pack = 32)` — writes daily pivot lows and highs (pivotSwingsInto with pivotStrength bars each side) and the low and high of the last five daily bars into three parallel output arrays; nothing when fewer than 12 daily bars are given
- `atrBuffer(array<float> h, array<float> l, array<float> c, float tick, float mult)` — a price distance of mult × the average true range of the last 20 bars (true range against each bar's previous close), rounded to the tick and never below one tick; 4 ticks when fewer than 21 bars are given
- `weightedClusters(array<float> cP, array<int> cT, float tol, array<float> wClust, array<int> ord, array<float> zPrice, array<int> zStart, array<int> zCount)` — single-pass 1-D clustering of prices in ascending order. Each price joins the last zone when it is within tol of that zone's current price, else it starts a new zone. A zone's price is its first member's price until a member with a positive weight joins, then Σ(price × w) / Σ w over its members, with w = wClust[type code]. A type code that is na or not a valid index into wClust, and a weight that is na or not positive, count as weight 0: the price still joins or starts a zone but does not move a weighted mean, and a zone whose weights are all 0 keeps its first member's price. Every array read and write is checked against that array's own size, so it cannot raise an index error. All four output arrays are cleared first; they must be four distinct arrays, none of them cP. A zone's lowest and highest member prices are cP[ord[zStart]] and cP[ord[zStart + zCount − 1]], because ord is in ascending price order.
- `prevTradingDate(int k, int skipA = dayofweek.saturday, int skipB = dayofweek.sunday, bool useCmeHolidays = true)` — the date before k that is neither of the two skipped weekdays and, when useCmeHolidays is true, not in TE Math's CME holiday table; it steps back at most 10 calendar days
- `weekMondayOf(int k)` — the Monday of the week that contains a date, both as yyyymmdd (a Sunday belongs to the week that began six days earlier)
- `weeklyHighLow(int key, array<int> sesK, array<float> sesH, array<float> sesL)` — one high and one low per completed week, folded from daily rows in order and keyed by each row's Monday; every row in the week containing `key` is left out. A row with an na high is a missing day: it makes ITS OWN week na (high and low), and no other week. A missing day must have both its high and low na; sesK must hold no na and be as long as sesH and sesL.
- `rowDepositProfile(array<float> rH, array<float> rL, array<float> rC, array<float> rV, float rowH, int lookback = 192)` — a volume profile of the last `lookback` rows in which each row's volume is spread EVENLY over the price rows it spans (row r covers [r × rowH, (r + 1) × rowH)), with a second array receiving the same shares times the close location (close − low) / (high − low)
- `type RegState` — the running state of an EMA 20 / EMA 50 / ATR 14 stepper over completed buckets. Create it with regStateNew().
- `regStateNew()` — a new, empty stepper state with an ATR length of 14 and empty rings
- `regStep(RegState s, float h, float l, float c)` — steps the state by one COMPLETED bucket: true range (high − low on the first bucket), EMA 20 and EMA 50 seeded with the first close, Wilder ATR 14, and the 6 / 20 / 20 rings. Call it once per completed bucket, oldest first.
The on-chart table described below belongs to the library itself: an importing script receives none of
it, only the functions above.
## 1. Seeing its own readout on a chart (optional)
1. Open the **Pine Editor** at the bottom of a TradingView chart.
2. Paste the contents of `te_structure_lib_v2.pine` from this folder.
3. **Save it under a new name** — never overwrite an existing script.
4. Click **Add to chart**.
⚠️ **TradingView pins a study to the version it was added at.** Saving a newer version does *not*
upgrade a chart that already has it — remove the study and re-add it. Check you got the new one by
its version and its number of settings, never by "I loaded it".
## 2. What appears, and what each part is telling you
Every readout explains itself **on hover** — in plain language first, then the formula, then why
that number matters, then what it does *not* tell you. Hover anything you are unsure about; that is
the fastest way to learn this tool, and it is the same four questions every time.
The hover text below is reproduced exactly as the script composes it, which is why `⟨live value⟩`
appears: that is the spot where a number calculated from **your** chart on **that** bar gets dropped
in. On screen you will see the number, not the marker — and that is the whole point of the design.
The explanation is about the bar you are looking at, not a dictionary entry about the concept.
**Over the last ⟨live value⟩ closed bars there are ⟨live value⟩ pivot lows and ⟨live value⟩ pivot highs with 3 bars on each side.**
- *How it is computed:* pivotSwingsInto: a low is a pivot when no bar within 3 on either side is lower and at least one of them is higher; a high is the mirror, so equal extremes inside the window still count.
- *Why it matters:* Pivots are where a run of bars turned, found by rule rather than by eye, so two scripts reading the same bars mark the same turns.
- *What it does not tell you:* A pivot is only known 3 bars after it prints; it is a record of a turn, not a level price will respect.
**Those ⟨live value⟩ pivot prices group into ⟨live value⟩ zones when prices within ⟨live value⟩a quarter ATR (still warming)⟨live value⟩ of each other are joined.**
- *How it is computed:* weightedClusters: sort ascending, then each price joins the last zone if it is within the tolerance of that zone's current price, whose value is the weighted mean Σ(p × w) / Σ w of its members.
- *Why it matters:* Nearby prices that differ by a few ticks usually describe one area; merging them turns a crowd of lines into a short list of places.
- *What it does not tell you:* Zones are counted, not ranked; a zone with many pivots is not claimed to be stronger than one with few.
**In the last ⟨live value⟩ closed bars there are ⟨live value⟩ strict 2-and-2 swings.**
- *How it is computed:* strictSwing2Prices: a low strictly below the two lows on each side, or a high strictly above the two highs on each side; any missing value in the five kills that swing.
- *Why it matters:* Strict inequality ignores double bottoms and flat tops, which gives a sparser, unambiguous list of turns than the tie-tolerant pivot above.
- *What it does not tell you:* A swing needs two bars after it, so the newest two bars can never qualify; it says nothing about whether the swing holds.
**The closed bar 4 back from the latest is a strict 4-and-4 swing: ⟨live value⟩.**
- *How it is computed:* strictPivot4At: its low is strictly below each of the 4 lows on either side (a swing low), or its high strictly above each of the 4 highs on either side (a swing high).
- *Why it matters:* Four bars is the earliest this test can be answered, so this row shows the newest turn that the rule can confirm right now.
- *What it does not tell you:* Both can be true on one wide bar and neither on most bars; a confirmed swing is history, not a forecast.
**Across the last ⟨live value⟩ closed bars the heaviest price row is centred at ⟨live value⟩, and its close-location share is ⟨live value⟩ (100% would mean every bar that built it closed at its high).**
- *How it is computed:* rowDepositProfile: each bar's volume is split evenly over the rows it spans, each row one fiftieth of the held range; a second array adds the same share times (close − low) / (high − low), and the share is that array over the volume.
- *Why it matters:* Where volume piled up is information a price line alone does not carry, and the close-location share adds whether those bars tended to finish near their highs or their lows.
- *What it does not tell you:* Volume is spread evenly across each bar's range because the bars do not say where inside the range it traded; the share is a candle-shape estimate, not a count of buyers.
**EMA 20 minus EMA 50 of the closes, divided by the ATR 14, after ⟨live value⟩ closed bars: ⟨live value⟩.**
- *How it is computed:* regStep: EMA 20 and EMA 50 with α = 2 / 21 and 2 / 51 seeded on the first close, and Wilder's ATR 14 of the true range, stepped once per closed bar.
- *Why it matters:* Dividing the gap between two averages by the ATR puts it in units of a typical bar, so the same reading means the same thing on any symbol and timeframe.
- *What it does not tell you:* The stepper stores readings and names no regime; no threshold on this number is part of the library.
**The last closed bar's exchange date is ⟨live value⟩; the weekday before it is ⟨live value⟩ and its week began on Monday ⟨live value⟩.**
- *How it is computed:* prevTradingDate steps back one calendar day at a time past Saturday and Sunday (the optional CME holiday table is off here); weekMondayOf subtracts (weekday + 5) mod 7 days.
- *Why it matters:* Integer date keys make it cheap to group bars into days and weeks, and to find the day before, without string handling.
- *What it does not tell you:* This row uses a plain weekday calendar; it does not know this market's holidays or whether it trades on weekends.
## 3. The settings
2 settings, in the order the dialog shows them.
### APPEARANCE
**Theme** — default `Dark` · options: Dark, Light
Which chart background this is drawn for. Changing it re-picks every colour so text and lines stay legible. It cannot detect your theme automatically, so set it to match your chart.
**Hover tooltips (on-chart explanations)** — default `true`
Shows or hides the explanation that appears when you hover a table cell or a label on the chart. Off removes that hover text only: every printed value, line, zone and alert is unchanged, and nothing is recomputed. Explanations in this settings dialog are not affected.
## 4. When not to trust it
Taken from the script's own limit clauses — these are the things it will never tell you, and it says
so on the chart rather than hiding them here:
- A pivot is only known 3 bars after it prints; it is a record of a turn, not a level price will respect.
- Zones are counted, not ranked; a zone with many pivots is not claimed to be stronger than one with few.
- A swing needs two bars after it, so the newest two bars can never qualify; it says nothing about whether the swing holds.
- Both can be true on one wide bar and neither on most bars; a confirmed swing is history, not a forecast.
- Volume is spread evenly across each bar's range because the bars do not say where inside the range it traded; the share is a candle-shape estimate, not a count of buyers.
- The stepper stores readings and names no regime; no threshold on this number is part of the library.
- This row uses a plain weekday calendar; it does not know this market's holidays or whether it trades on weekends.
---
_Not financial advice. This tool describes what has already happened; it does not predict._
Library "TEStructure_PivotSwings_Clusters_RowProfile"
Price-structure maths for Pine arrays: pivot swings with tie handling, strict 4-and-4 and 2-and-2 swings, a weighted single-pass 1-D clustering, trading-date and week keys with the calendar as arguments, a rolling volume profile that spreads each bar over its rows with a close-location share, and an EMA 20/50 plus ATR 14 stepper. No trading rules.
pivotSwingsInto(h, l, left, right, lowT, highT, lowL, highL, cP, cT, cL, ts, dur, pack)
writes every pivot low and pivot high of the arrays into three parallel output arrays. Bar i is a pivot low when no bar in [i − left, i + right] has a lower low and at least one other bar there has a higher low (equal lows are allowed; a flat window is not a pivot); a pivot high is the mirror. The low is written before the high for the same bar.
Parameters:
h (array<float>): highs, oldest first
l (array<float>): lows, oldest first (the scan covers min(size(h), size(l)) bars)
left (int): bars to the left of a pivot
right (int): bars to the right of a pivot (the last `right` bars can never be pivots)
lowT (int): the type code written next to each pivot low
highT (int): the type code written next to each pivot high
lowL (int): the label code for a pivot low; pack × (ts + dur) is added to it
highL (int): the label code for a pivot high; pack × (ts + dur) is added to it
cP (array<float>): output: prices are pushed here
cT (array<int>): output: type codes are pushed here
cL (array<int>): output: label codes are pushed here
ts (array<int>): each bar's start time (at least as many entries as bars); pass zeros to write no time
dur (int): the bar length in milliseconds, so ts + dur is the end of the pivot's bar
pack (int): the multiplier that packs the end time into the label code (32 keeps five bits for the label)
Returns: true
strictPivot4At(hs, ls, p, side)
whether the value at p is a strict 4-and-4 swing: for side 1 the low at p is strictly below each of the 4 lows on either side, for side −1 the high at p is strictly above each of the 4 highs on either side
Parameters:
hs (array<float>): highs, oldest first
ls (array<float>): lows, oldest first
p (int): the index to test; it is read without a bounds check, so 4 ≤ p ≤ size − 5 is the caller's to guarantee
side (int): 1 tests the lows, −1 tests the highs
Returns: true when the value at p is a strict swing on that side
strictSwing2Prices(hs, ls, lb)
every strict 2-and-2 swing over the last lb values: a low strictly below the 2 lows on each side, a high strictly above the 2 highs on each side. An na anywhere in the five values of a window kills that window's swings. For each index the low (if any) is written before the high.
Parameters:
hs (array<float>): highs, oldest first (one per row; na marks a missing row)
ls (array<float>): lows, oldest first, the same length as hs
lb (int): how many of the most recent rows to scan
Returns: a new array of the swing prices in index order
sessionExtremesInto(ts, h, l, cP, cT, cL, tys, lbs, tz, rollMs, rthOpen, rthClose, rollMin, useCmeHolidays, pack)
Parameters:
ts (array<int>)
h (array<float>)
l (array<float>)
cP (array<float>)
cT (array<int>)
cL (array<int>)
tys (array<int>)
lbs (array<int>)
tz (string)
rollMs (int)
rthOpen (int)
rthClose (int)
rollMin (int)
useCmeHolidays (bool)
pack (int)
dailyLevelsInto(dH, dL, pivotStrength, cP, cT, cL, tys, lbs, pack)
Parameters:
dH (array<float>)
dL (array<float>)
pivotStrength (int)
cP (array<float>)
cT (array<int>)
cL (array<int>)
tys (array<int>)
lbs (array<int>)
pack (int)
atrBuffer(h, l, c, tick, mult)
Parameters:
h (array<float>)
l (array<float>)
c (array<float>)
tick (float)
mult (float)
weightedClusters(cP, cT, tol, wClust, ord, zPrice, zStart, zCount)
Parameters:
cP (array<float>)
cT (array<int>)
tol (float)
wClust (array<float>)
ord (array<int>)
zPrice (array<float>)
zStart (array<int>)
zCount (array<int>)
prevTradingDate(k, skipA, skipB, useCmeHolidays)
Parameters:
k (int)
skipA (int)
skipB (int)
useCmeHolidays (bool)
weekMondayOf(k)
Parameters:
k (int)
weeklyHighLow(key, sesK, sesH, sesL)
Parameters:
key (int)
sesK (array<int>)
sesH (array<float>)
sesL (array<float>)
rowDepositProfile(rH, rL, rC, rV, rowH, lookback)
Parameters:
rH (array<float>)
rL (array<float>)
rC (array<float>)
rV (array<float>)
rowH (float)
lookback (int)
regStateNew()
regStep(s, h, l, c)
Parameters:
s (RegState)
h (float)
l (float)
c (float)
RegState
the running state of an EMA 20 / EMA 50 / ATR 14 stepper over completed buckets. Create it with regStateNew().
Fields:
emaF (series float): EMA 20 of the closes
emaS (series float): EMA 50 of the closes
atr (series float): Wilder ATR 14 (na for the first 13 buckets)
prevC (series float): the last close stepped
tr (series float): the last true range
n (series int): the number of buckets stepped
w (Atr type from TradersEdgeUSA/TEMath_WilderSuperTrend_TickGridValueArea/1): TE Math's Wilder ATR state behind atr
emaFHist (array<float>): the last 6 EMA 20 values, newest last
hi20 (array<float>): the last 20 highs, newest last
lo20 (array<float>): the last 20 lows, newest last
- `strictPivot4At(array<float> hs, array<float> ls, int p, int side)` — whether the value at p is a strict 4-and-4 swing: for side 1 the low at p is strictly below each of the 4 lows on either side, for side −1 the high at p is strictly above each of the 4 highs on either side
- `strictSwing2Prices(array<float> hs, array<float> ls, int lb)` — every strict 2-and-2 swing over the last lb values: a low strictly below the 2 lows on each side, a high strictly above the 2 highs on each side. An na anywhere in the five values of a window kills that window's swings. For each index the low (if any) is written before the high.
- `sessionExtremesInto(array<int> ts, array<float> h, array<float> l, array<float> cP, array<int> cT, array<int> cL, array<int> tys, array<int> lbs, string tz = "America/New_York", int rollMs = 21600000, int rthOpen = 570, int rthClose = 960, int rollMin = 1080, bool useCmeHolidays = true, int pack = 32)` — writes the prior-session extremes of a bar series into three parallel output arrays: the low and high of the newest two COMPLETED regular sessions ("prior" and "two sessions back") and of the newest two out-of-session periods ("overnight" and the one before it). Each bar is keyed to a trading date = its date in tz after adding rollMs; it is in the regular session when its minute of day in tz is in [rthOpen, rthClose) and, when useCmeHolidays is true, its trading date is not in TE Math's CME holiday table. Today's regular session counts as prior only once the last bar's minute is in [rthClose, rollMin). Each extreme's label code carries pack × (its bar's time + 1), the first bar that printed it.
- `dailyLevelsInto(array<float> dH, array<float> dL, int pivotStrength, array<float> cP, array<int> cT, array<int> cL, array<int> tys, array<int> lbs, int pack = 32)` — writes daily pivot lows and highs (pivotSwingsInto with pivotStrength bars each side) and the low and high of the last five daily bars into three parallel output arrays; nothing when fewer than 12 daily bars are given
- `atrBuffer(array<float> h, array<float> l, array<float> c, float tick, float mult)` — a price distance of mult × the average true range of the last 20 bars (true range against each bar's previous close), rounded to the tick and never below one tick; 4 ticks when fewer than 21 bars are given
- `weightedClusters(array<float> cP, array<int> cT, float tol, array<float> wClust, array<int> ord, array<float> zPrice, array<int> zStart, array<int> zCount)` — single-pass 1-D clustering of prices in ascending order. Each price joins the last zone when it is within tol of that zone's current price, else it starts a new zone. A zone's price is its first member's price until a member with a positive weight joins, then Σ(price × w) / Σ w over its members, with w = wClust[type code]. A type code that is na or not a valid index into wClust, and a weight that is na or not positive, count as weight 0: the price still joins or starts a zone but does not move a weighted mean, and a zone whose weights are all 0 keeps its first member's price. Every array read and write is checked against that array's own size, so it cannot raise an index error. All four output arrays are cleared first; they must be four distinct arrays, none of them cP. A zone's lowest and highest member prices are cP[ord[zStart]] and cP[ord[zStart + zCount − 1]], because ord is in ascending price order.
- `prevTradingDate(int k, int skipA = dayofweek.saturday, int skipB = dayofweek.sunday, bool useCmeHolidays = true)` — the date before k that is neither of the two skipped weekdays and, when useCmeHolidays is true, not in TE Math's CME holiday table; it steps back at most 10 calendar days
- `weekMondayOf(int k)` — the Monday of the week that contains a date, both as yyyymmdd (a Sunday belongs to the week that began six days earlier)
- `weeklyHighLow(int key, array<int> sesK, array<float> sesH, array<float> sesL)` — one high and one low per completed week, folded from daily rows in order and keyed by each row's Monday; every row in the week containing `key` is left out. A row with an na high is a missing day: it makes ITS OWN week na (high and low), and no other week. A missing day must have both its high and low na; sesK must hold no na and be as long as sesH and sesL.
- `rowDepositProfile(array<float> rH, array<float> rL, array<float> rC, array<float> rV, float rowH, int lookback = 192)` — a volume profile of the last `lookback` rows in which each row's volume is spread EVENLY over the price rows it spans (row r covers [r × rowH, (r + 1) × rowH)), with a second array receiving the same shares times the close location (close − low) / (high − low)
- `type RegState` — the running state of an EMA 20 / EMA 50 / ATR 14 stepper over completed buckets. Create it with regStateNew().
- `regStateNew()` — a new, empty stepper state with an ATR length of 14 and empty rings
- `regStep(RegState s, float h, float l, float c)` — steps the state by one COMPLETED bucket: true range (high − low on the first bucket), EMA 20 and EMA 50 seeded with the first close, Wilder ATR 14, and the 6 / 20 / 20 rings. Call it once per completed bucket, oldest first.
The on-chart table described below belongs to the library itself: an importing script receives none of
it, only the functions above.
## 1. Seeing its own readout on a chart (optional)
1. Open the **Pine Editor** at the bottom of a TradingView chart.
2. Paste the contents of `te_structure_lib_v2.pine` from this folder.
3. **Save it under a new name** — never overwrite an existing script.
4. Click **Add to chart**.
⚠️ **TradingView pins a study to the version it was added at.** Saving a newer version does *not*
upgrade a chart that already has it — remove the study and re-add it. Check you got the new one by
its version and its number of settings, never by "I loaded it".
## 2. What appears, and what each part is telling you
Every readout explains itself **on hover** — in plain language first, then the formula, then why
that number matters, then what it does *not* tell you. Hover anything you are unsure about; that is
the fastest way to learn this tool, and it is the same four questions every time.
The hover text below is reproduced exactly as the script composes it, which is why `⟨live value⟩`
appears: that is the spot where a number calculated from **your** chart on **that** bar gets dropped
in. On screen you will see the number, not the marker — and that is the whole point of the design.
The explanation is about the bar you are looking at, not a dictionary entry about the concept.
**Over the last ⟨live value⟩ closed bars there are ⟨live value⟩ pivot lows and ⟨live value⟩ pivot highs with 3 bars on each side.**
- *How it is computed:* pivotSwingsInto: a low is a pivot when no bar within 3 on either side is lower and at least one of them is higher; a high is the mirror, so equal extremes inside the window still count.
- *Why it matters:* Pivots are where a run of bars turned, found by rule rather than by eye, so two scripts reading the same bars mark the same turns.
- *What it does not tell you:* A pivot is only known 3 bars after it prints; it is a record of a turn, not a level price will respect.
**Those ⟨live value⟩ pivot prices group into ⟨live value⟩ zones when prices within ⟨live value⟩a quarter ATR (still warming)⟨live value⟩ of each other are joined.**
- *How it is computed:* weightedClusters: sort ascending, then each price joins the last zone if it is within the tolerance of that zone's current price, whose value is the weighted mean Σ(p × w) / Σ w of its members.
- *Why it matters:* Nearby prices that differ by a few ticks usually describe one area; merging them turns a crowd of lines into a short list of places.
- *What it does not tell you:* Zones are counted, not ranked; a zone with many pivots is not claimed to be stronger than one with few.
**In the last ⟨live value⟩ closed bars there are ⟨live value⟩ strict 2-and-2 swings.**
- *How it is computed:* strictSwing2Prices: a low strictly below the two lows on each side, or a high strictly above the two highs on each side; any missing value in the five kills that swing.
- *Why it matters:* Strict inequality ignores double bottoms and flat tops, which gives a sparser, unambiguous list of turns than the tie-tolerant pivot above.
- *What it does not tell you:* A swing needs two bars after it, so the newest two bars can never qualify; it says nothing about whether the swing holds.
**The closed bar 4 back from the latest is a strict 4-and-4 swing: ⟨live value⟩.**
- *How it is computed:* strictPivot4At: its low is strictly below each of the 4 lows on either side (a swing low), or its high strictly above each of the 4 highs on either side (a swing high).
- *Why it matters:* Four bars is the earliest this test can be answered, so this row shows the newest turn that the rule can confirm right now.
- *What it does not tell you:* Both can be true on one wide bar and neither on most bars; a confirmed swing is history, not a forecast.
**Across the last ⟨live value⟩ closed bars the heaviest price row is centred at ⟨live value⟩, and its close-location share is ⟨live value⟩ (100% would mean every bar that built it closed at its high).**
- *How it is computed:* rowDepositProfile: each bar's volume is split evenly over the rows it spans, each row one fiftieth of the held range; a second array adds the same share times (close − low) / (high − low), and the share is that array over the volume.
- *Why it matters:* Where volume piled up is information a price line alone does not carry, and the close-location share adds whether those bars tended to finish near their highs or their lows.
- *What it does not tell you:* Volume is spread evenly across each bar's range because the bars do not say where inside the range it traded; the share is a candle-shape estimate, not a count of buyers.
**EMA 20 minus EMA 50 of the closes, divided by the ATR 14, after ⟨live value⟩ closed bars: ⟨live value⟩.**
- *How it is computed:* regStep: EMA 20 and EMA 50 with α = 2 / 21 and 2 / 51 seeded on the first close, and Wilder's ATR 14 of the true range, stepped once per closed bar.
- *Why it matters:* Dividing the gap between two averages by the ATR puts it in units of a typical bar, so the same reading means the same thing on any symbol and timeframe.
- *What it does not tell you:* The stepper stores readings and names no regime; no threshold on this number is part of the library.
**The last closed bar's exchange date is ⟨live value⟩; the weekday before it is ⟨live value⟩ and its week began on Monday ⟨live value⟩.**
- *How it is computed:* prevTradingDate steps back one calendar day at a time past Saturday and Sunday (the optional CME holiday table is off here); weekMondayOf subtracts (weekday + 5) mod 7 days.
- *Why it matters:* Integer date keys make it cheap to group bars into days and weeks, and to find the day before, without string handling.
- *What it does not tell you:* This row uses a plain weekday calendar; it does not know this market's holidays or whether it trades on weekends.
## 3. The settings
2 settings, in the order the dialog shows them.
### APPEARANCE
**Theme** — default `Dark` · options: Dark, Light
Which chart background this is drawn for. Changing it re-picks every colour so text and lines stay legible. It cannot detect your theme automatically, so set it to match your chart.
**Hover tooltips (on-chart explanations)** — default `true`
Shows or hides the explanation that appears when you hover a table cell or a label on the chart. Off removes that hover text only: every printed value, line, zone and alert is unchanged, and nothing is recomputed. Explanations in this settings dialog are not affected.
## 4. When not to trust it
Taken from the script's own limit clauses — these are the things it will never tell you, and it says
so on the chart rather than hiding them here:
- A pivot is only known 3 bars after it prints; it is a record of a turn, not a level price will respect.
- Zones are counted, not ranked; a zone with many pivots is not claimed to be stronger than one with few.
- A swing needs two bars after it, so the newest two bars can never qualify; it says nothing about whether the swing holds.
- Both can be true on one wide bar and neither on most bars; a confirmed swing is history, not a forecast.
- Volume is spread evenly across each bar's range because the bars do not say where inside the range it traded; the share is a candle-shape estimate, not a count of buyers.
- The stepper stores readings and names no regime; no threshold on this number is part of the library.
- This row uses a plain weekday calendar; it does not know this market's holidays or whether it trades on weekends.
---
_Not financial advice. This tool describes what has already happened; it does not predict._
Library "TEStructure_PivotSwings_Clusters_RowProfile"
Price-structure maths for Pine arrays: pivot swings with tie handling, strict 4-and-4 and 2-and-2 swings, a weighted single-pass 1-D clustering, trading-date and week keys with the calendar as arguments, a rolling volume profile that spreads each bar over its rows with a close-location share, and an EMA 20/50 plus ATR 14 stepper. No trading rules.
pivotSwingsInto(h, l, left, right, lowT, highT, lowL, highL, cP, cT, cL, ts, dur, pack)
writes every pivot low and pivot high of the arrays into three parallel output arrays. Bar i is a pivot low when no bar in [i − left, i + right] has a lower low and at least one other bar there has a higher low (equal lows are allowed; a flat window is not a pivot); a pivot high is the mirror. The low is written before the high for the same bar.
Parameters:
h (array<float>): highs, oldest first
l (array<float>): lows, oldest first (the scan covers min(size(h), size(l)) bars)
left (int): bars to the left of a pivot
right (int): bars to the right of a pivot (the last `right` bars can never be pivots)
lowT (int): the type code written next to each pivot low
highT (int): the type code written next to each pivot high
lowL (int): the label code for a pivot low; pack × (ts + dur) is added to it
highL (int): the label code for a pivot high; pack × (ts + dur) is added to it
cP (array<float>): output: prices are pushed here
cT (array<int>): output: type codes are pushed here
cL (array<int>): output: label codes are pushed here
ts (array<int>): each bar's start time (at least as many entries as bars); pass zeros to write no time
dur (int): the bar length in milliseconds, so ts + dur is the end of the pivot's bar
pack (int): the multiplier that packs the end time into the label code (32 keeps five bits for the label)
Returns: true
strictPivot4At(hs, ls, p, side)
whether the value at p is a strict 4-and-4 swing: for side 1 the low at p is strictly below each of the 4 lows on either side, for side −1 the high at p is strictly above each of the 4 highs on either side
Parameters:
hs (array<float>): highs, oldest first
ls (array<float>): lows, oldest first
p (int): the index to test; it is read without a bounds check, so 4 ≤ p ≤ size − 5 is the caller's to guarantee
side (int): 1 tests the lows, −1 tests the highs
Returns: true when the value at p is a strict swing on that side
strictSwing2Prices(hs, ls, lb)
every strict 2-and-2 swing over the last lb values: a low strictly below the 2 lows on each side, a high strictly above the 2 highs on each side. An na anywhere in the five values of a window kills that window's swings. For each index the low (if any) is written before the high.
Parameters:
hs (array<float>): highs, oldest first (one per row; na marks a missing row)
ls (array<float>): lows, oldest first, the same length as hs
lb (int): how many of the most recent rows to scan
Returns: a new array of the swing prices in index order
sessionExtremesInto(ts, h, l, cP, cT, cL, tys, lbs, tz, rollMs, rthOpen, rthClose, rollMin, useCmeHolidays, pack)
Parameters:
ts (array<int>)
h (array<float>)
l (array<float>)
cP (array<float>)
cT (array<int>)
cL (array<int>)
tys (array<int>)
lbs (array<int>)
tz (string)
rollMs (int)
rthOpen (int)
rthClose (int)
rollMin (int)
useCmeHolidays (bool)
pack (int)
dailyLevelsInto(dH, dL, pivotStrength, cP, cT, cL, tys, lbs, pack)
Parameters:
dH (array<float>)
dL (array<float>)
pivotStrength (int)
cP (array<float>)
cT (array<int>)
cL (array<int>)
tys (array<int>)
lbs (array<int>)
pack (int)
atrBuffer(h, l, c, tick, mult)
Parameters:
h (array<float>)
l (array<float>)
c (array<float>)
tick (float)
mult (float)
weightedClusters(cP, cT, tol, wClust, ord, zPrice, zStart, zCount)
Parameters:
cP (array<float>)
cT (array<int>)
tol (float)
wClust (array<float>)
ord (array<int>)
zPrice (array<float>)
zStart (array<int>)
zCount (array<int>)
prevTradingDate(k, skipA, skipB, useCmeHolidays)
Parameters:
k (int)
skipA (int)
skipB (int)
useCmeHolidays (bool)
weekMondayOf(k)
Parameters:
k (int)
weeklyHighLow(key, sesK, sesH, sesL)
Parameters:
key (int)
sesK (array<int>)
sesH (array<float>)
sesL (array<float>)
rowDepositProfile(rH, rL, rC, rV, rowH, lookback)
Parameters:
rH (array<float>)
rL (array<float>)
rC (array<float>)
rV (array<float>)
rowH (float)
lookback (int)
regStateNew()
regStep(s, h, l, c)
Parameters:
s (RegState)
h (float)
l (float)
c (float)
RegState
the running state of an EMA 20 / EMA 50 / ATR 14 stepper over completed buckets. Create it with regStateNew().
Fields:
emaF (series float): EMA 20 of the closes
emaS (series float): EMA 50 of the closes
atr (series float): Wilder ATR 14 (na for the first 13 buckets)
prevC (series float): the last close stepped
tr (series float): the last true range
n (series int): the number of buckets stepped
w (Atr type from TradersEdgeUSA/TEMath_WilderSuperTrend_TickGridValueArea/1): TE Math's Wilder ATR state behind atr
emaFHist (array<float>): the last 6 EMA 20 values, newest last
hi20 (array<float>): the last 20 highs, newest last
lo20 (array<float>): the last 20 lows, newest last
Release Note
⚠️ **TradingView pins a study to the version it was added at.** Saving a newer version does *not*upgrade a chart that already has it — remove the study and re-add it. Check you got the new one by
its version and its number of settings, never by "I loaded it".
## 2. What appears, and what each part is telling you
Every readout explains itself **on hover** — in plain language first, then the formula, then why
that number matters, then what it does *not* tell you. Hover anything you are unsure about; that is
the fastest way to learn this tool, and it is the same four questions every time.
The hover text below is reproduced exactly as the script composes it, which is why `⟨live value⟩`
appears: that is the spot where a number calculated from **your** chart on **that** bar gets dropped
in. On screen you will see the number, not the marker — and that is the whole point of the design.
The explanation is about the bar you are looking at, not a dictionary entry about the concept.
**Over the last ⟨live value⟩ closed bars there are ⟨live value⟩ pivot lows and ⟨live value⟩ pivot highs with 3 bars on each side.**
- *How it is computed:* pivotSwingsInto: a low is a pivot when no bar within 3 on either side is lower and at least one of them is higher; a high is the mirror, so equal extremes inside the window still count.
- *Why it matters:* Pivots are where a run of bars turned, found by rule rather than by eye, so two scripts reading the same bars mark the same turns.
- *What it does not tell you:* A pivot is only known 3 bars after it prints; it is a record of a turn, not a level price will respect.
**Those ⟨live value⟩ pivot prices group into ⟨live value⟩ zones when prices within ⟨live value⟩a quarter ATR (still warming)⟨live value⟩ of each other are joined.**
- *How it is computed:* weightedClusters: sort ascending, then each price joins the last zone if it is within the tolerance of that zone's current price, whose value is the weighted mean Σ(p × w) / Σ w of its members.
- *Why it matters:* Nearby prices that differ by a few ticks usually describe one area; merging them turns a crowd of lines into a short list of places.
- *What it does not tell you:* Zones are counted, not ranked; a zone with many pivots is not claimed to be stronger than one with few.
**In the last ⟨live value⟩ closed bars there are ⟨live value⟩ strict 2-and-2 swings.**
- *How it is computed:* strictSwing2Prices: a low strictly below the two lows on each side, or a high strictly above the two highs on each side; any missing value in the five kills that swing.
- *Why it matters:* Strict inequality ignores double bottoms and flat tops, which gives a sparser, unambiguous list of turns than the tie-tolerant pivot above.
- *What it does not tell you:* A swing needs two bars after it, so the newest two bars can never qualify; it says nothing about whether the swing holds.
**The closed bar 4 back from the latest is a strict 4-and-4 swing: ⟨live value⟩.**
- *How it is computed:* strictPivot4At: its low is strictly below each of the 4 lows on either side (a swing low), or its high strictly above each of the 4 highs on either side (a swing high).
- *Why it matters:* Four bars is the earliest this test can be answered, so this row shows the newest turn that the rule can confirm right now.
- *What it does not tell you:* Both can be true on one wide bar and neither on most bars; a confirmed swing is history, not a forecast.
**Across the last ⟨live value⟩ closed bars the heaviest price row is centred at ⟨live value⟩, and its close-location share is ⟨live value⟩ (100% would mean every bar that built it closed at its high).**
- *How it is computed:* rowDepositProfile: each bar's volume is split evenly over the rows it spans, each row one fiftieth of the held range; a second array adds the same share times (close − low) / (high − low), and the share is that array over the volume.
- *Why it matters:* Where volume piled up is information a price line alone does not carry, and the close-location share adds whether those bars tended to finish near their highs or their lows.
- *What it does not tell you:* Volume is spread evenly across each bar's range because the bars do not say where inside the range it traded; the share is a candle-shape estimate, not a count of buyers.
**EMA 20 minus EMA 50 of the closes, divided by the ATR 14, after ⟨live value⟩ closed bars: ⟨live value⟩.**
- *How it is computed:* regStep: EMA 20 and EMA 50 with α = 2 / 21 and 2 / 51 seeded on the first close, and Wilder's ATR 14 of the true range, stepped once per closed bar.
- *Why it matters:* Dividing the gap between two averages by the ATR puts it in units of a typical bar, so the same reading means the same thing on any symbol and timeframe.
- *What it does not tell you:* The stepper stores readings and names no regime; no threshold on this number is part of the library.
**The last closed bar's exchange date is ⟨live value⟩; the weekday before it is ⟨live value⟩ and its week began on Monday ⟨live value⟩.**
- *How it is computed:* prevTradingDate steps back one calendar day at a time past Saturday and Sunday (the optional CME holiday table is off here); weekMondayOf subtracts (weekday + 5) mod 7 days.
- *Why it matters:* Integer date keys make it cheap to group bars into days and weeks, and to find the day before, without string handling.
- *What it does not tell you:* This row uses a plain weekday calendar; it does not know this market's holidays or whether it trades on weekends.
## 3. The settings
2 settings, in the order the dialog shows them.
### APPEARANCE
**Theme** — default `Dark` · options: Dark, Light
Which chart background this is drawn for. Changing it re-picks every colour so text and lines stay legible. It cannot detect your theme automatically, so set it to match your chart.
**Hover tooltips (on-chart explanations)** — default `true`
Shows or hides the explanation that appears when you hover a table cell or a label on the chart. Off removes that hover text only: every printed value, line, zone and alert is unchanged, and nothing is recomputed. Explanations in this settings dialog are not affected.
## 4. When not to trust it
Taken from the script's own limit clauses — these are the things it will never tell you, and it says
so on the chart rather than hiding them here:
A pivot is only known 3 bars after it prints; it is a record of a turn, not a level price will respect.
Zones are counted, not ranked; a zone with many pivots is not claimed to be stronger than one with few.
A swing needs two bars after it, so the newest two bars can never qualify; it says nothing about whether the swing holds.
Both can be true on one wide bar and neither on most bars; a confirmed swing is history, not a forecast.
Not financial advice. This tool describes what has already happened; it does not predict.

คำจำกัดสิทธิ์ความรับผิดชอบ
ข้อมูลและบทความไม่ได้มีวัตถุประสงค์เพื่อก่อให้เกิดกิจกรรมทางการเงิน, การลงทุน, การซื้อขาย, ข้อเสนอแนะ หรือคำแนะนำประเภทอื่น ๆ ที่ให้หรือรับรองโดย TradingView อ่านเพิ่มเติมใน ข้อกำหนดการใช้งาน
คำจำกัดสิทธิ์ความรับผิดชอบ
ข้อมูลและบทความไม่ได้มีวัตถุประสงค์เพื่อก่อให้เกิดกิจกรรมทางการเงิน, การลงทุน, การซื้อขาย, ข้อเสนอแนะ หรือคำแนะนำประเภทอื่น ๆ ที่ให้หรือรับรองโดย TradingView อ่านเพิ่มเติมใน ข้อกำหนดการใช้งาน