OPEN-SOURCE SCRIPT
KNN Supertrend Horizon [LuxAlgo]
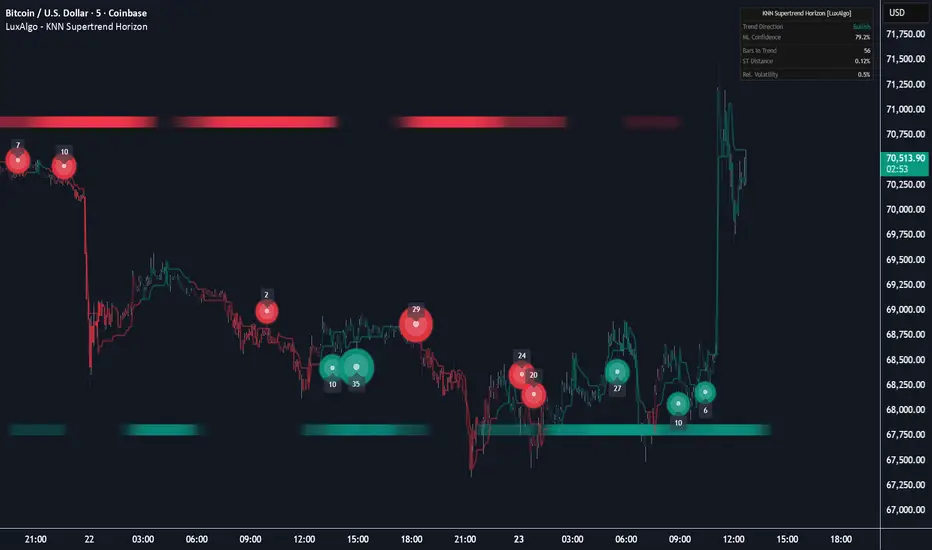
The KNN Supertrend Horizon indicator is a machine learning tool that combines K-Nearest Neighbors (KNN) classification with Supertrend logic to identify high-probability trend directions and price rejection zones.
🔶 USAGE
The indicator provides a comprehensive view of market trends by filtering traditional Supertrend calculations through a machine learning engine. It is designed to help traders stay on the right side of the trend while identifying potential exhaustion points through visual "Rejection Orbs."
🔹 Trend Identification
The core trend logic is driven by the KNN engine, which analyzes RSI and volatility (ATR) features over a lookback window to determine the most likely trend direction. When the ML confidence aligns with the Supertrend, the indicator displays a colored horizon at the top or bottom of the chart.
🔹 3D Rejection Orbs
Specialized rejection signals appear when price interacts with the Supertrend level and forms a significant wick.
🔹 Confidence Visualization
The script features "Liquid Smooth" gradient candle coloring. The intensity of the candle colors shifts based on the ML engine's confidence level. Brighter, more vibrant colors indicate a high-conviction trend, while muted colors suggest the trend may be weakening or entering a sideways phase.
🔶 DETAILS
The KNN engine functions by searching for historical similarities in price behavior. By comparing the current RSI and ATR-based volatility to the past N bars (Search Window), it finds the K closest matches (Neighbors) to predict the current trend state. A confidence buffer is applied to this probability to filter out market noise and prevent rapid signal flipping.
🔶 SETTINGS
🔹 Machine Learning Settings
🔹 Supertrend Settings
🔹 Noise Filter Settings
🔹 Rejection Signal Settings
🔹 Visual & Dashboard Settings
🔶 USAGE
The indicator provides a comprehensive view of market trends by filtering traditional Supertrend calculations through a machine learning engine. It is designed to help traders stay on the right side of the trend while identifying potential exhaustion points through visual "Rejection Orbs."
🔹 Trend Identification
The core trend logic is driven by the KNN engine, which analyzes RSI and volatility (ATR) features over a lookback window to determine the most likely trend direction. When the ML confidence aligns with the Supertrend, the indicator displays a colored horizon at the top or bottom of the chart.
🔹 3D Rejection Orbs
Specialized rejection signals appear when price interacts with the Supertrend level and forms a significant wick.
- The size of the orb is dynamically adjusted based on relative volume.
- A label attached to the orb displays the exact volume of the rejection candle.
- These orbs serve as potential entry or exit signals where price is "bouncing" off the trend baseline.
🔹 Confidence Visualization
The script features "Liquid Smooth" gradient candle coloring. The intensity of the candle colors shifts based on the ML engine's confidence level. Brighter, more vibrant colors indicate a high-conviction trend, while muted colors suggest the trend may be weakening or entering a sideways phase.
🔶 DETAILS
The KNN engine functions by searching for historical similarities in price behavior. By comparing the current RSI and ATR-based volatility to the past N bars (Search Window), it finds the K closest matches (Neighbors) to predict the current trend state. A confidence buffer is applied to this probability to filter out market noise and prevent rapid signal flipping.
🔶 SETTINGS
🔹 Machine Learning Settings
- K-Neighbors: The number of historical neighbors the algorithm looks for to determine the trend direction.
- Search Window: The lookback period (in bars) used to find similar historical patterns.
🔹 Supertrend Settings
- ATR Length: The period used for the Average True Range calculation.
- Factor: The multiplier applied to the ATR to set the distance of the Supertrend line.
🔹 Noise Filter Settings
- Smooth Price Input: Enables HMA smoothing on the price source used for ML features.
- ML Confidence Buffer (%): The percentage threshold above/below 50% required to trigger a trend change.
🔹 Rejection Signal Settings
- Show 3D Rejection Orbs: Toggles the visibility of the volume-based rejection bubbles.
- Min Wick-to-Body Multiplier: The required ratio of wick length to body size to qualify as a rejection.
- Min Bubble Gap: The minimum number of bars required between consecutive rejection signals.
🔹 Visual & Dashboard Settings
- Liquid Smoothness: Controls the EMA smoothing applied to the ML confidence for visual gradients.
- Vibrancy: Increases the color intensity of the gradient candles and horizons.
- Show Dashboard: Toggles the real-time statistics table containing trend direction, ML confidence, and relative volatility.
สคริปต์โอเพนซอร์ซ
ด้วยเจตนารมณ์หลักของ TradingView ผู้สร้างสคริปต์นี้ได้ทำให้เป็นโอเพนซอร์ส เพื่อให้เทรดเดอร์สามารถตรวจสอบและยืนยันฟังก์ชันการทำงานของมันได้ ขอชื่นชมผู้เขียน! แม้ว่าคุณจะใช้งานได้ฟรี แต่โปรดจำไว้ว่าการเผยแพร่โค้ดซ้ำจะต้องเป็นไปตาม กฎระเบียบการใช้งาน ของเรา

Build your own edge with AI: luxalgo.com
All content provided by LuxAlgo is for informational & educational purposes only. Past performance does not guarantee future results.
All content provided by LuxAlgo is for informational & educational purposes only. Past performance does not guarantee future results.
คำจำกัดสิทธิ์ความรับผิดชอบ
ข้อมูลและบทความไม่ได้มีวัตถุประสงค์เพื่อก่อให้เกิดกิจกรรมทางการเงิน, การลงทุน, การซื้อขาย, ข้อเสนอแนะ หรือคำแนะนำประเภทอื่น ๆ ที่ให้หรือรับรองโดย TradingView อ่านเพิ่มเติมใน ข้อกำหนดการใช้งาน
สคริปต์โอเพนซอร์ซ
ด้วยเจตนารมณ์หลักของ TradingView ผู้สร้างสคริปต์นี้ได้ทำให้เป็นโอเพนซอร์ส เพื่อให้เทรดเดอร์สามารถตรวจสอบและยืนยันฟังก์ชันการทำงานของมันได้ ขอชื่นชมผู้เขียน! แม้ว่าคุณจะใช้งานได้ฟรี แต่โปรดจำไว้ว่าการเผยแพร่โค้ดซ้ำจะต้องเป็นไปตาม กฎระเบียบการใช้งาน ของเรา
Build your own edge with AI: luxalgo.com
All content provided by LuxAlgo is for informational & educational purposes only. Past performance does not guarantee future results.
All content provided by LuxAlgo is for informational & educational purposes only. Past performance does not guarantee future results.
คำจำกัดสิทธิ์ความรับผิดชอบ
ข้อมูลและบทความไม่ได้มีวัตถุประสงค์เพื่อก่อให้เกิดกิจกรรมทางการเงิน, การลงทุน, การซื้อขาย, ข้อเสนอแนะ หรือคำแนะนำประเภทอื่น ๆ ที่ให้หรือรับรองโดย TradingView อ่านเพิ่มเติมใน ข้อกำหนดการใช้งาน