OPEN-SOURCE SCRIPT
Astro: Time-Degree Trend Lines [invincible3]
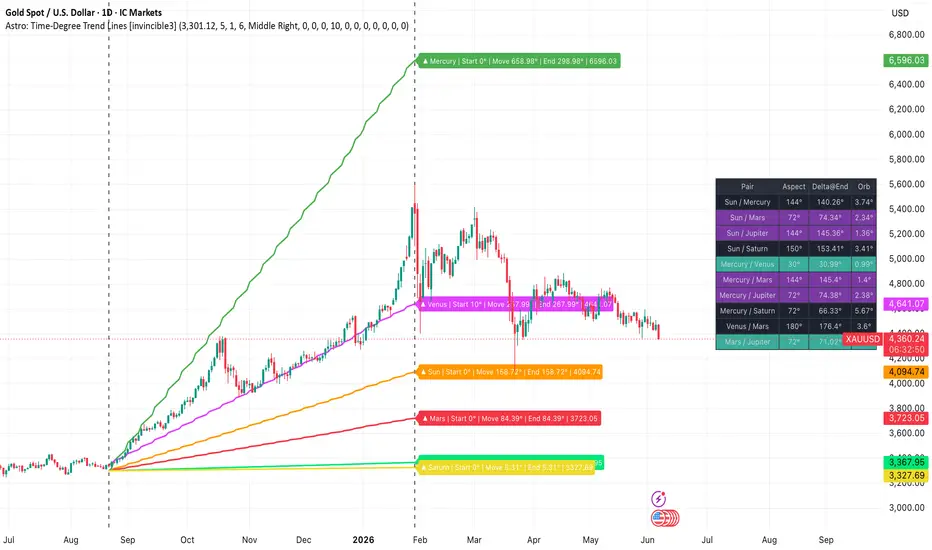
Astro-Gann Time-Degree Trend Lines – Invincible3
Astro-Gann Time-Degree Trend Lines is a range-based financial astrology and Gann timing tool designed to project planetary motion into price space.
Instead of plotting ordinary planetary positions, this indicator converts planetary movement into price-degree trend lines using a selected anchor price, anchor time, end time, user-defined planetary starting degrees, a motion harmonic multiplier, and a custom price-per-degree scale.
The concept is based on the Gann principle that time, price, and degrees can be harmonically related. Each planet’s movement over the selected range is converted into price movement, allowing traders to study planetary speed, time cycles, price vibration, and harmonic market geometry directly on the chart.
The indicator also includes a Gann-style aspect table that compares planet-to-planet angular relationships at the end of the selected range using each planet’s manually entered starting degree. This makes the aspect logic more meaningful because planets no longer begin from a common zero point. Each planet can start from its own real zodiac degree, ephemeris-based value, or symbolic Gann degree.
This tool is especially useful for traders who apply W.D. Gann methods, planetary time cycles, price-time squaring, astro-harmonics, Square of 9 logic, 360° degree geometry, and financial astrology to identify possible zones of trend continuation, support, resistance, vibration, or reversal timing.
What This Indicator Does
The indicator starts from a selected anchor price and anchor time.
Each planet also has a user-defined starting degree at the anchor. From that point, the script calculates how many degrees each planet moves during the selected date range, adds that motion to the planet’s starting degree, and then converts the resulting degree value into a projected price level.
The projection model is:
Planetary Motion = Days × Average Daily Motion × Motion Harmonic Multiplier
Line Degree = Starting Degree + Planetary Motion
Projected Price = Anchor Price ± (Line Degree × Points Per Degree)
This means the starting degree directly affects the trend-line position.
For example, if the Sun starts at 4°, moves 30°, and the selected scale is 10 points per degree, then:
Line Degree = 4° + 30° = 34°
Projected Price = Anchor Price ± 340 points
So the line does not only represent planetary movement from zero. It represents the full start-degree-adjusted Gann line degree.
Core Concept
This is not a standard astronomical aspect indicator. It is a Gann-style time-degree projection tool.
The purpose is to study:
How many degrees each planet moves during a selected market range.
How planetary motion can be translated into price.
How each planet’s starting degree changes the projected line position.
Which planets produce stronger or weaker price-time slopes.
Where planetary degree projections align with price structure.
Which planet pairs form Gann/astro harmonic relationships at the end of the range.
This makes the indicator useful for analyzing market vibration, planetary speed relationships, price-time geometry, harmonic projection, and range-based astro-Gann timing.
Key Features
Range-Based Astro-Gann Projection
Select a custom time range using:
Anchor Time
End Time
Anchor Price
The indicator calculates planetary movement across this exact range and projects it onto the price chart.
This allows traders to study planetary motion from an important market event such as:
Major swing high
Major swing low
Breakout point
Crash low
All-time high
Cycle start
First trading date
Gann anniversary date
Important planetary event
Major economic or market cycle date
The selected range becomes the measurement window for planetary movement and Gann degree projection.
User-Defined Starting Degrees
Each planet has a manual starting degree input.
This allows traders to enter the actual zodiac degree or symbolic Gann degree of each planet at the anchor date.
The starting degree affects:
The plotted planetary trend-line position
The projected price level
The end label
The final line degree
The aspect-table end longitude
This correction is important because each planet no longer starts from 0°. Each body can begin from its own real, ephemeris-based, or symbolic starting degree.
For price projection, the indicator uses:
Line Degree = Starting Degree + Planetary Motion
For aspect calculations, the indicator uses:
End Longitude = Starting Degree + Signed Planetary Motion
Planetary Time-Degree Trend Lines
The indicator plots planetary motion lines for:
☉ Sun
☾ Moon
☿ Mercury
♀ Venus
♂ Mars
♃ Jupiter
♄ Saturn
♅ Uranus
♆ Neptune
♇ Pluto
☊ Lunar Node
Each planet has:
Its own average daily motion
Its own starting degree
Its own projected line degree
Its own color setting
Its own visibility toggle
The final trend-line position is based on the planet’s starting degree plus its movement over the selected range.
Uptrend and Downtrend Projection
The indicator can plot:
Upward planetary projection lines
Downward planetary projection lines
Upward lines project planetary degree movement above the anchor price.
Downward lines project planetary degree movement below the anchor price.
This allows traders to study both bullish and bearish price-time pathways from the same anchor.
For example:
Up projection = Anchor Price + Line Degree × Points Per Degree
Down projection = Anchor Price - Line Degree × Points Per Degree
This gives a balanced way to study both expansion and contraction from a selected market point.
Points Per Degree Scaling
The user can define how many price points represent one planetary degree.
Examples:
1 point per degree
10 points per degree
100 points per degree
Custom market-specific scaling
This is useful because every market has a different vibration.
Gold, Bitcoin, forex pairs, stocks, commodities, and indices may require different degree-to-price scaling.
The purpose is to find a scale where planetary degree projections align meaningfully with market structure, swing points, or harmonic price zones.
Motion Harmonic Multiplier
The motion harmonic multiplier can be used to increase or decrease the speed of planetary projection.
Examples:
1x = normal planetary motion
2x = double-speed harmonic
0.5x = half-speed harmonic
This can be useful for traders who study:
Harmonic repetition
Accelerated cycles
Compressed planetary timing
Higher-frequency market vibration
Fractional planetary movement
The motion harmonic multiplier changes the planetary movement component of the line.
It affects the slope and speed of the planetary projection. It should be understood as a speed or cycle multiplier, not as a 360° price octave shift.
Gann Aspect Table
The indicator includes a compact aspect table that compares planet-to-planet angular relationships at the end of the selected range.
The table uses each planet’s starting degree and signed planetary motion:
End Longitude = Starting Degree + Signed Planetary Motion
Then it calculates the angular separation between planet pairs and finds the nearest Gann/astro aspect.
Supported aspect angles include:
0° Conjunction
30° Semi-sextile
45° Semi-square
60° Sextile
72° Quintile
90° Square
120° Trine
135° Sesquiquadrate
144° Biquintile / Gann harmonic
150° Quincunx
180° Opposition
The table displays:
Planet pair
Nearest aspect
Angular delta at range end
Orb from exact aspect
This helps identify which planet pairs are in close harmonic relationship at the end of the selected range.
Aspect Interpretation for Gann Traders
In financial astrology and Gann analysis, aspects are not used only as traditional astrology signals. They are also treated as geometric divisions of the 360° circle.
Important divisions include:
45° and 90° for square pressure and market action
60° and 120° for smoother harmonic flow
72° and 144° for fifth-harmonic and pentagonal geometry
180° for opposition, polarity, and possible culmination
30° and 150° for adjustment zones
When a planet pair forms a tight orb near one of these angles, it may indicate a time window where market rhythm, volatility, or direction can shift.
The table is not meant to be used as a standalone signal. It is designed to provide astro-Gann confluence with price structure, swing points, trendlines, Fibonacci levels, cycle dates, and market context.
How to Use
1. Choose an Important Market Anchor Point
Select a meaningful market point such as:
Major swing high
Major swing low
Breakout level
Crash low
All-time high
All-time low
First trading date
Cycle start
Gann anniversary date
This anchor becomes the origin point for the projection.
2. Set the Anchor Price
Enter the price level from which the planetary degree lines will begin.
This is usually the price of the selected swing high, swing low, breakout, or cycle point.
3. Set the Anchor Time and End Time
Choose the start and end dates of the range.
The indicator calculates planetary movement across this selected time window.
The range defines the time component of the Astro-Gann projection.
4. Enter Starting Degrees for Each Planet
Enter the starting degree for each planet at the anchor date.
These can be:
Actual zodiac degrees from an ephemeris
Geocentric planetary degrees
Heliocentric planetary degrees
Symbolic Gann degrees
Custom cycle degrees chosen by the trader
The starting degree affects both the trend-line position and the aspect-table calculation.
5. Adjust Points Per Degree
Increase or decrease the price-per-degree value until the projected planetary lines match the market’s vibration.
Different markets may require different scales.
For example:
Gold may respond better to one scale.
Bitcoin may require a larger scale.
Forex may require a smaller scale.
Stocks and indices may need symbol-specific calibration.
6. Adjust the Motion Harmonic Multiplier
Use the motion harmonic multiplier to test faster or slower planetary projection rhythms.
For example:
1x = normal planetary speed
2x = double-speed projection
0.5x = half-speed projection
This is useful when studying compressed cycles, expanded cycles, or harmonic repetitions of planetary motion.
7. Enable the Planets You Want to Study
Enable or disable planets depending on your trading timeframe.
General use:
Moon, Mercury, Venus = faster short-term timing
Sun and Mars = intermediate timing
Jupiter and Saturn = larger cycle structure
Uranus, Neptune, Pluto = macro or long-term harmonic background
Node = long-cycle timing reference in financial astrology
8. Use the Aspect Table
Look for tight orbs between planet pairs near important Gann aspects such as:
45°
60°
72°
90°
120°
135°
144°
150°
180°
The tighter the orb, the closer the pair is to an exact harmonic relationship at the end of the selected range.
Use this as timing confluence, not as a mechanical buy/sell signal.
Practical Trading Applications
This indicator can be used to study:
Price-time squaring
Planetary degree projection
Market vibration
Time-cycle completion
Harmonic resistance and support zones
Planetary speed-based trend slopes
Start-degree-adjusted planetary projection
Possible reversal windows
Range-based astro-Gann confluence
Planet-to-planet harmonic relationships
It is best used together with normal market structure tools such as:
Swing highs and lows
Trendlines
Fibonacci levels
Support and resistance
Volume
Momentum indicators
Cycle dates
Seasonality
Volatility zones
The strongest use case is when planetary lines, motion harmonics, aspect-table harmonics, and technical market structure all point to the same zone.
Important Notes
This indicator uses average daily planetary motion, not a full astronomical ephemeris engine.
The starting degrees are entered manually by the user. For more accurate astrology-based analysis, users should obtain planetary degrees from an ephemeris and enter them into the starting degree fields.
The starting degrees affect both:
Visual projection lines
Aspect-table calculations
This makes the tool more consistent with range-based Astro-Gann analysis.
The Lunar Node is commonly treated as retrograde in zodiac motion. For price-line projection, absolute motion may be used for clean visual direction, while aspect logic respects signed motion.
Because this is a Gann-style projection tool, the purpose is not to predict with certainty. The purpose is to map possible price-time harmonics and observe where market structure reacts around those projected levels.
Known Limitations
Planetary positions are based on average motion, not high-precision ephemeris calculations.
Manual starting degrees are required for meaningful projection and aspect-table results.
The indicator does not automatically fetch real-time planetary longitude.
The motion harmonic multiplier changes projection speed, not a 360° price octave.
Results should be treated as analytical confluence, not standalone trade signals.
Best Use Case
This tool is best suited for traders who already use or are studying:
W.D. Gann methods
Financial astrology
Planetary price-time projection
Square of 9 logic
360° degree geometry
Astro-cycle timing
Harmonic market geometry
Planetary speed relationships
Price-time squaring
It is designed for traders who want to visually connect planetary motion, starting degrees, time range, and price movement directly on the chart.
Summary
Astro-Gann Time-Degree Trend Lines – Invincible3 converts planetary motion into price-degree projections using a selected market range.
The corrected logic combines:
Starting Degree
Planetary Motion
Motion Harmonic Multiplier
Price-per-degree scaling
This creates a practical Astro-Gann projection model where each planet has its own degree origin, its own movement, and its own projected price path.
The result is a charting tool for studying planetary price-time geometry, market vibration, harmonic resistance/support, and possible reversal timing.
Disclaimer
This indicator is for educational and analytical purposes only. It does not provide financial advice or guaranteed market predictions. Always combine astro-Gann analysis with risk management, market structure, and independent trading judgment.
Astro-Gann Time-Degree Trend Lines is a range-based financial astrology and Gann timing tool designed to project planetary motion into price space.
Instead of plotting ordinary planetary positions, this indicator converts planetary movement into price-degree trend lines using a selected anchor price, anchor time, end time, user-defined planetary starting degrees, a motion harmonic multiplier, and a custom price-per-degree scale.
The concept is based on the Gann principle that time, price, and degrees can be harmonically related. Each planet’s movement over the selected range is converted into price movement, allowing traders to study planetary speed, time cycles, price vibration, and harmonic market geometry directly on the chart.
The indicator also includes a Gann-style aspect table that compares planet-to-planet angular relationships at the end of the selected range using each planet’s manually entered starting degree. This makes the aspect logic more meaningful because planets no longer begin from a common zero point. Each planet can start from its own real zodiac degree, ephemeris-based value, or symbolic Gann degree.
This tool is especially useful for traders who apply W.D. Gann methods, planetary time cycles, price-time squaring, astro-harmonics, Square of 9 logic, 360° degree geometry, and financial astrology to identify possible zones of trend continuation, support, resistance, vibration, or reversal timing.
What This Indicator Does
The indicator starts from a selected anchor price and anchor time.
Each planet also has a user-defined starting degree at the anchor. From that point, the script calculates how many degrees each planet moves during the selected date range, adds that motion to the planet’s starting degree, and then converts the resulting degree value into a projected price level.
The projection model is:
Planetary Motion = Days × Average Daily Motion × Motion Harmonic Multiplier
Line Degree = Starting Degree + Planetary Motion
Projected Price = Anchor Price ± (Line Degree × Points Per Degree)
This means the starting degree directly affects the trend-line position.
For example, if the Sun starts at 4°, moves 30°, and the selected scale is 10 points per degree, then:
Line Degree = 4° + 30° = 34°
Projected Price = Anchor Price ± 340 points
So the line does not only represent planetary movement from zero. It represents the full start-degree-adjusted Gann line degree.
Core Concept
This is not a standard astronomical aspect indicator. It is a Gann-style time-degree projection tool.
The purpose is to study:
How many degrees each planet moves during a selected market range.
How planetary motion can be translated into price.
How each planet’s starting degree changes the projected line position.
Which planets produce stronger or weaker price-time slopes.
Where planetary degree projections align with price structure.
Which planet pairs form Gann/astro harmonic relationships at the end of the range.
This makes the indicator useful for analyzing market vibration, planetary speed relationships, price-time geometry, harmonic projection, and range-based astro-Gann timing.
Key Features
Range-Based Astro-Gann Projection
Select a custom time range using:
Anchor Time
End Time
Anchor Price
The indicator calculates planetary movement across this exact range and projects it onto the price chart.
This allows traders to study planetary motion from an important market event such as:
Major swing high
Major swing low
Breakout point
Crash low
All-time high
Cycle start
First trading date
Gann anniversary date
Important planetary event
Major economic or market cycle date
The selected range becomes the measurement window for planetary movement and Gann degree projection.
User-Defined Starting Degrees
Each planet has a manual starting degree input.
This allows traders to enter the actual zodiac degree or symbolic Gann degree of each planet at the anchor date.
The starting degree affects:
The plotted planetary trend-line position
The projected price level
The end label
The final line degree
The aspect-table end longitude
This correction is important because each planet no longer starts from 0°. Each body can begin from its own real, ephemeris-based, or symbolic starting degree.
For price projection, the indicator uses:
Line Degree = Starting Degree + Planetary Motion
For aspect calculations, the indicator uses:
End Longitude = Starting Degree + Signed Planetary Motion
Planetary Time-Degree Trend Lines
The indicator plots planetary motion lines for:
☉ Sun
☾ Moon
☿ Mercury
♀ Venus
♂ Mars
♃ Jupiter
♄ Saturn
♅ Uranus
♆ Neptune
♇ Pluto
☊ Lunar Node
Each planet has:
Its own average daily motion
Its own starting degree
Its own projected line degree
Its own color setting
Its own visibility toggle
The final trend-line position is based on the planet’s starting degree plus its movement over the selected range.
Uptrend and Downtrend Projection
The indicator can plot:
Upward planetary projection lines
Downward planetary projection lines
Upward lines project planetary degree movement above the anchor price.
Downward lines project planetary degree movement below the anchor price.
This allows traders to study both bullish and bearish price-time pathways from the same anchor.
For example:
Up projection = Anchor Price + Line Degree × Points Per Degree
Down projection = Anchor Price - Line Degree × Points Per Degree
This gives a balanced way to study both expansion and contraction from a selected market point.
Points Per Degree Scaling
The user can define how many price points represent one planetary degree.
Examples:
1 point per degree
10 points per degree
100 points per degree
Custom market-specific scaling
This is useful because every market has a different vibration.
Gold, Bitcoin, forex pairs, stocks, commodities, and indices may require different degree-to-price scaling.
The purpose is to find a scale where planetary degree projections align meaningfully with market structure, swing points, or harmonic price zones.
Motion Harmonic Multiplier
The motion harmonic multiplier can be used to increase or decrease the speed of planetary projection.
Examples:
1x = normal planetary motion
2x = double-speed harmonic
0.5x = half-speed harmonic
This can be useful for traders who study:
Harmonic repetition
Accelerated cycles
Compressed planetary timing
Higher-frequency market vibration
Fractional planetary movement
The motion harmonic multiplier changes the planetary movement component of the line.
It affects the slope and speed of the planetary projection. It should be understood as a speed or cycle multiplier, not as a 360° price octave shift.
Gann Aspect Table
The indicator includes a compact aspect table that compares planet-to-planet angular relationships at the end of the selected range.
The table uses each planet’s starting degree and signed planetary motion:
End Longitude = Starting Degree + Signed Planetary Motion
Then it calculates the angular separation between planet pairs and finds the nearest Gann/astro aspect.
Supported aspect angles include:
0° Conjunction
30° Semi-sextile
45° Semi-square
60° Sextile
72° Quintile
90° Square
120° Trine
135° Sesquiquadrate
144° Biquintile / Gann harmonic
150° Quincunx
180° Opposition
The table displays:
Planet pair
Nearest aspect
Angular delta at range end
Orb from exact aspect
This helps identify which planet pairs are in close harmonic relationship at the end of the selected range.
Aspect Interpretation for Gann Traders
In financial astrology and Gann analysis, aspects are not used only as traditional astrology signals. They are also treated as geometric divisions of the 360° circle.
Important divisions include:
45° and 90° for square pressure and market action
60° and 120° for smoother harmonic flow
72° and 144° for fifth-harmonic and pentagonal geometry
180° for opposition, polarity, and possible culmination
30° and 150° for adjustment zones
When a planet pair forms a tight orb near one of these angles, it may indicate a time window where market rhythm, volatility, or direction can shift.
The table is not meant to be used as a standalone signal. It is designed to provide astro-Gann confluence with price structure, swing points, trendlines, Fibonacci levels, cycle dates, and market context.
How to Use
1. Choose an Important Market Anchor Point
Select a meaningful market point such as:
Major swing high
Major swing low
Breakout level
Crash low
All-time high
All-time low
First trading date
Cycle start
Gann anniversary date
This anchor becomes the origin point for the projection.
2. Set the Anchor Price
Enter the price level from which the planetary degree lines will begin.
This is usually the price of the selected swing high, swing low, breakout, or cycle point.
3. Set the Anchor Time and End Time
Choose the start and end dates of the range.
The indicator calculates planetary movement across this selected time window.
The range defines the time component of the Astro-Gann projection.
4. Enter Starting Degrees for Each Planet
Enter the starting degree for each planet at the anchor date.
These can be:
Actual zodiac degrees from an ephemeris
Geocentric planetary degrees
Heliocentric planetary degrees
Symbolic Gann degrees
Custom cycle degrees chosen by the trader
The starting degree affects both the trend-line position and the aspect-table calculation.
5. Adjust Points Per Degree
Increase or decrease the price-per-degree value until the projected planetary lines match the market’s vibration.
Different markets may require different scales.
For example:
Gold may respond better to one scale.
Bitcoin may require a larger scale.
Forex may require a smaller scale.
Stocks and indices may need symbol-specific calibration.
6. Adjust the Motion Harmonic Multiplier
Use the motion harmonic multiplier to test faster or slower planetary projection rhythms.
For example:
1x = normal planetary speed
2x = double-speed projection
0.5x = half-speed projection
This is useful when studying compressed cycles, expanded cycles, or harmonic repetitions of planetary motion.
7. Enable the Planets You Want to Study
Enable or disable planets depending on your trading timeframe.
General use:
Moon, Mercury, Venus = faster short-term timing
Sun and Mars = intermediate timing
Jupiter and Saturn = larger cycle structure
Uranus, Neptune, Pluto = macro or long-term harmonic background
Node = long-cycle timing reference in financial astrology
8. Use the Aspect Table
Look for tight orbs between planet pairs near important Gann aspects such as:
45°
60°
72°
90°
120°
135°
144°
150°
180°
The tighter the orb, the closer the pair is to an exact harmonic relationship at the end of the selected range.
Use this as timing confluence, not as a mechanical buy/sell signal.
Practical Trading Applications
This indicator can be used to study:
Price-time squaring
Planetary degree projection
Market vibration
Time-cycle completion
Harmonic resistance and support zones
Planetary speed-based trend slopes
Start-degree-adjusted planetary projection
Possible reversal windows
Range-based astro-Gann confluence
Planet-to-planet harmonic relationships
It is best used together with normal market structure tools such as:
Swing highs and lows
Trendlines
Fibonacci levels
Support and resistance
Volume
Momentum indicators
Cycle dates
Seasonality
Volatility zones
The strongest use case is when planetary lines, motion harmonics, aspect-table harmonics, and technical market structure all point to the same zone.
Important Notes
This indicator uses average daily planetary motion, not a full astronomical ephemeris engine.
The starting degrees are entered manually by the user. For more accurate astrology-based analysis, users should obtain planetary degrees from an ephemeris and enter them into the starting degree fields.
The starting degrees affect both:
Visual projection lines
Aspect-table calculations
This makes the tool more consistent with range-based Astro-Gann analysis.
The Lunar Node is commonly treated as retrograde in zodiac motion. For price-line projection, absolute motion may be used for clean visual direction, while aspect logic respects signed motion.
Because this is a Gann-style projection tool, the purpose is not to predict with certainty. The purpose is to map possible price-time harmonics and observe where market structure reacts around those projected levels.
Known Limitations
Planetary positions are based on average motion, not high-precision ephemeris calculations.
Manual starting degrees are required for meaningful projection and aspect-table results.
The indicator does not automatically fetch real-time planetary longitude.
The motion harmonic multiplier changes projection speed, not a 360° price octave.
Results should be treated as analytical confluence, not standalone trade signals.
Best Use Case
This tool is best suited for traders who already use or are studying:
W.D. Gann methods
Financial astrology
Planetary price-time projection
Square of 9 logic
360° degree geometry
Astro-cycle timing
Harmonic market geometry
Planetary speed relationships
Price-time squaring
It is designed for traders who want to visually connect planetary motion, starting degrees, time range, and price movement directly on the chart.
Summary
Astro-Gann Time-Degree Trend Lines – Invincible3 converts planetary motion into price-degree projections using a selected market range.
The corrected logic combines:
Starting Degree
Planetary Motion
Motion Harmonic Multiplier
Price-per-degree scaling
This creates a practical Astro-Gann projection model where each planet has its own degree origin, its own movement, and its own projected price path.
The result is a charting tool for studying planetary price-time geometry, market vibration, harmonic resistance/support, and possible reversal timing.
Disclaimer
This indicator is for educational and analytical purposes only. It does not provide financial advice or guaranteed market predictions. Always combine astro-Gann analysis with risk management, market structure, and independent trading judgment.
สคริปต์โอเพนซอร์ซ
ด้วยเจตนารมณ์หลักของ TradingView ผู้สร้างสคริปต์นี้ได้ทำให้เป็นโอเพนซอร์ส เพื่อให้เทรดเดอร์สามารถตรวจสอบและยืนยันฟังก์ชันการทำงานของมันได้ ขอชื่นชมผู้เขียน! แม้ว่าคุณจะใช้งานได้ฟรี แต่โปรดจำไว้ว่าการเผยแพร่โค้ดซ้ำจะต้องเป็นไปตาม กฎระเบียบการใช้งาน ของเรา

คำจำกัดสิทธิ์ความรับผิดชอบ
ข้อมูลและบทความไม่ได้มีวัตถุประสงค์เพื่อก่อให้เกิดกิจกรรมทางการเงิน, การลงทุน, การซื้อขาย, ข้อเสนอแนะ หรือคำแนะนำประเภทอื่น ๆ ที่ให้หรือรับรองโดย TradingView อ่านเพิ่มเติมใน ข้อกำหนดการใช้งาน
สคริปต์โอเพนซอร์ซ
ด้วยเจตนารมณ์หลักของ TradingView ผู้สร้างสคริปต์นี้ได้ทำให้เป็นโอเพนซอร์ส เพื่อให้เทรดเดอร์สามารถตรวจสอบและยืนยันฟังก์ชันการทำงานของมันได้ ขอชื่นชมผู้เขียน! แม้ว่าคุณจะใช้งานได้ฟรี แต่โปรดจำไว้ว่าการเผยแพร่โค้ดซ้ำจะต้องเป็นไปตาม กฎระเบียบการใช้งาน ของเรา
คำจำกัดสิทธิ์ความรับผิดชอบ
ข้อมูลและบทความไม่ได้มีวัตถุประสงค์เพื่อก่อให้เกิดกิจกรรมทางการเงิน, การลงทุน, การซื้อขาย, ข้อเสนอแนะ หรือคำแนะนำประเภทอื่น ๆ ที่ให้หรือรับรองโดย TradingView อ่านเพิ่มเติมใน ข้อกำหนดการใช้งาน