Elsea Heat Band & MAs
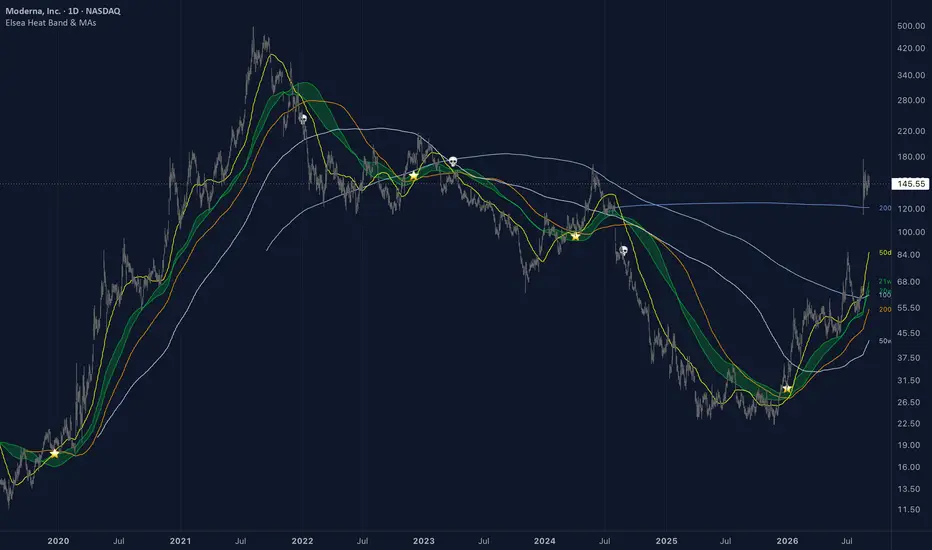
Elsea Heat Band & MAs is a moving-average utility: it draws the medium-term band (also known as the Bull Market Support Band / Bear Market Resistance Band, credit: Benjamin Cowen) alongside a set of conventional daily and weekly moving averages, on a single overlay with independent toggles for each group.
There is nothing novel in the calculations here. Every line is a standard SMA or EMA at a conventional length, and the cross detection is the standard 50/200 golden and death cross. The script exists to put a specific combination on one chart with consistent colouring, per-group toggles and end-of-series labels, rather than to introduce a new method. It is open-source for that reason.
WHAT IT DRAWS
HOW TO USE IT
Each of the three groups toggles independently, so the script can serve as a Heat Band overlay alone, a conventional MA set alone, or all of it together.
The band is medium-term structure: price above it has been above its twenty-week baseline, price below it has not. The weekly averages are long-horizon reference levels, most useful on instruments with many years of history. The 50/200 cross is included because it is widely watched, not because it is predictive — it is a lagging construction by definition, and the markers are there to locate the event on the chart rather than to endorse it.
LIMITATIONS
There is nothing novel in the calculations here. Every line is a standard SMA or EMA at a conventional length, and the cross detection is the standard 50/200 golden and death cross. The script exists to put a specific combination on one chart with consistent colouring, per-group toggles and end-of-series labels, rather than to introduce a new method. It is open-source for that reason.
WHAT IT DRAWS
- Heat Band — a 140-day SMA and a 147-day EMA (roughly twenty and twenty-one weeks of trading days) with a shaded fill between them. Using both an SMA and an EMA at slightly offset lengths gives a band rather than a line, blending flat-window and recency weighting.
- Daily MAs — 50-day and 200-day SMAs, with star and skull markers where the 50 crosses the 200 in either direction.
- Weekly MAs — 50, 100, 200 and 300-week SMAs, computed as 350, 700, 1400 and 2100 daily bars, coloured on a single blue ramp so the ordering is readable at a glance.
- Labels — at the right edge of the series, each visible average is labelled with its length.
HOW TO USE IT
Each of the three groups toggles independently, so the script can serve as a Heat Band overlay alone, a conventional MA set alone, or all of it together.
The band is medium-term structure: price above it has been above its twenty-week baseline, price below it has not. The weekly averages are long-horizon reference levels, most useful on instruments with many years of history. The 50/200 cross is included because it is widely watched, not because it is predictive — it is a lagging construction by definition, and the markers are there to locate the event on the chart rather than to endorse it.
LIMITATIONS
- All averages are computed from daily closes regardless of chart timeframe, so they are stepped on intraday charts and update once per day.
- Weekly averages are approximated as multiples of seven daily bars, not calendar weeks. On instruments that do not trade seven days a week the effective calendar period is longer than the label suggests. This is intended for consistency with the daily series, but the labels are approximate.
- The longest average needs roughly 2100 daily bars before it produces a value. On instruments with less history it will not plot.
- Moving averages lag by construction, and the longer ones lag substantially. Nothing here identifies a turn as it happens.
- The 50/200 cross is a widely known lagging signal with no edge implied by its inclusion.
- This is an analysis tool. It does not predict direction and produces no buy or sell recommendations.

คำจำกัดสิทธิ์ความรับผิดชอบ
ข้อมูลและบทความไม่ได้มีวัตถุประสงค์เพื่อก่อให้เกิดกิจกรรมทางการเงิน, การลงทุน, การซื้อขาย, ข้อเสนอแนะ หรือคำแนะนำประเภทอื่น ๆ ที่ให้หรือรับรองโดย TradingView อ่านเพิ่มเติมใน ข้อกำหนดการใช้งาน
คำจำกัดสิทธิ์ความรับผิดชอบ
ข้อมูลและบทความไม่ได้มีวัตถุประสงค์เพื่อก่อให้เกิดกิจกรรมทางการเงิน, การลงทุน, การซื้อขาย, ข้อเสนอแนะ หรือคำแนะนำประเภทอื่น ๆ ที่ให้หรือรับรองโดย TradingView อ่านเพิ่มเติมใน ข้อกำหนดการใช้งาน