Yield Spread FX
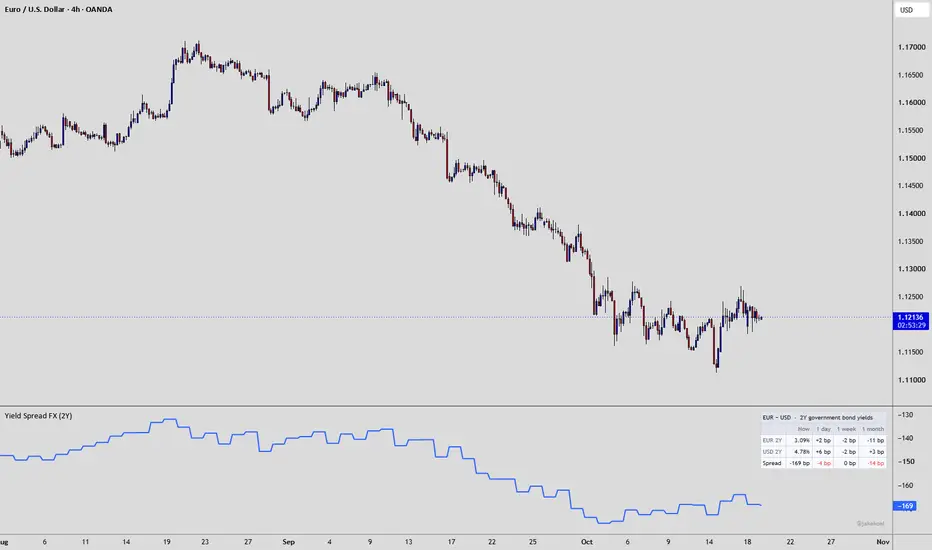
Yield Spread FX shows the gap between two countries' government bond yields — the "rate differential" — directly under your forex chart. On EUR/USD it compares German and US 2-year yields, on GBP/USD UK and US yields, and so on for all major pairs, with the 1-day, 1-week and 1-month change of each yield and of the spread in one table.
WHY FX TRADERS WATCH GOVERNMENT BOND YIELDS
A 2-year government bond pays roughly what investors expect the central bank's interest rate to average over the next two years. That makes the 2-year yield the market's running estimate of monetary policy:
• When traders expect more hikes (or fewer cuts), the 2-year yield rises.
• When they expect cuts, it falls.
Yields react to every data release, speech and central bank meeting, often before the decision itself. Research on the Federal Reserve (Gürkaynak, Sack & Swanson, 2005) shows that central bank communication about the future path of rates moves government bond yields, not only the decision on the day. (The exact meeting-by-meeting probabilities of a hike or cut are calculated from interest rate futures; the 2-year yield shows the overall expected path.)
WHY THE SPREAD BETWEEN TWO YIELDS MATTERS
A currency pair is a comparison of two economies, so what matters is not one country's rates but the gap between them. When the rate gap moves in a currency's favour, that currency tends to strengthen:
• Federal Reserve research (Curcuru, 2017) estimated that the US dollar rises roughly 2.5–5% against major currencies after a 1 percentage point surprise increase in expected US rates over the next two years.
• Academic work on exchange rates (Engel, NBER) finds that a currency tends to strengthen when its interest rates rise relative to other countries'.
• The New York Fed's own reports on foreign exchange operations have cited the US–German 2-year spread as a factor behind moves in EUR/USD.
In short: the level of the spread shows which currency offers higher expected rates; the change in the spread shows which way rate expectations are moving.
HOW BANKS AND FUNDS USE IT
Rate differentials are one of the main inputs professional FX desks track:
• Bank FX strategists build short-term "fair value" models for currency pairs, and the 2-year rate differential is a core input. ING, for example, lists 2-year swap rate differentials first among its model's drivers, alongside equities, the shape of the yield curve, risk sentiment and commodities.
• Rate differentials drive the carry trade — borrowing in low-yield currencies to invest in high-yield ones — which the Bank for International Settlements has documented among hedge funds and other investors.
• Professional desks often measure rate expectations with interest rate swaps; government bond yields move very closely with them and are the closest equivalent available on TradingView.
Important: the link between rates and currencies is not constant. Risk sentiment, energy prices, safe-haven flows and positioning can dominate for weeks (for example, during an energy shock a currency can fall even while its yields rise). The spread explains the rate story behind a pair — it is context for your analysis, not a buy or sell signal.
WHAT THE INDICATOR SHOWS
Two views (Settings → Display → Show):
• Spread — one line: base currency yield minus quote currency yield, in basis points (bp). Rising = rate expectations moving towards the base currency (supportive for the pair). Falling = moving towards the quote currency.
• Both yields — the two yields as separate lines, in %. The gap between them is the spread, and the line that is moving shows which country is driving it — for example whether a wider EUR/USD spread comes from US yields falling or German yields rising.
The table:
• Now — each yield and the spread right now (live).
• 1 day — change since each bond's previous close (so it always shows the latest full daily move, also in the evening and at weekends).
• 1 week — change over 5 trading days.
• 1 month — change over 21 trading days.
Spread changes are coloured: green = moving towards the base currency, red = towards the quote currency. Yield changes are neutral, because a rising yield helps one side of the pair and hurts the other.
YIELDS AND MATURITIES
Auto mode (default) picks the yields from the chart and switches when you change pairs:
USD → US, EUR → Germany, GBP → UK, JPY → Japan, CHF → Switzerland, CAD → Canada, AUD → Australia, NZD → New Zealand. This covers all 28 pairs between these eight currencies.
Why Germany for the euro: German bonds are the euro area's benchmark — the safest and most liquid euro government bonds — so their yields mostly reflect ECB rate expectations. Yields of other euro countries also include country-specific risk (government debt, politics), which would blur the rate signal.
Maturity (Auto mode):
• 2Y (default) — expected central bank rates over the next two years; the standard choice for rate expectations.
• 5Y — a mix of the rate path and the medium-term economic outlook.
• 10Y — long-term growth and inflation expectations, plus the extra yield investors demand for long-term government debt. A rising 10-year spread can reflect worries about government borrowing rather than central bank policy, so read it with care.
Manual mode lets you compare any two yields, whatever the chart — for example French 2Y vs German 2Y to see the political/fiscal risk premium inside the euro area.
DATA TIMING (NO REPAINTING)
Bond markets close at different times from forex (US bonds, for example, close after the forex day ends). If daily data were simply combined, a pair could be compared with a bond price from the previous day. Yield Spread FX matches each yield to the forex day by its trading date, using each bond's hourly data up to the forex close where needed, so both yields always belong to the same day.
• Daily and higher charts: today's values update live, like price; past values do not change.
• Intraday charts: the line shows the last completed day, so history never changes (no repainting). The table always shows today's live values.
• A yield that has not updated for more than 7 days is shown as "—" rather than an old number.
Data: TradingView TVC government bond yields (e.g. TVC:US02Y, TVC:DE02Y).
HOW TO USE IT
• Check whether the rate story supports your bias: is the spread moving towards or against the currency you want to buy?
• Use "Both yields" after a central bank meeting or a major data release to see which country's yields moved — is it a Fed story or an ECB story?
• Compare the spread with price. If the spread keeps moving one way and the pair goes the other, something other than rates (risk, energy, positioning) is driving the pair — worth finding out what.
• Weekly, daily and 4H charts suit it best, as the data is daily.
SETTINGS
• Yields: Mode (Auto / Manual), Maturity (2Y / 5Y / 10Y), First and second yield for Manual mode.
• Display: Spread or Both yields, line colour and width.
• Yield line colours: one colour per currency, plus two for Manual mode.
• Table: show/hide, position, text size, colours for spread changes.
Colours are readable on light and dark charts and can all be changed.
This indicator is for analysis and education only. It is not financial advice and does not generate trading signals.
WHY FX TRADERS WATCH GOVERNMENT BOND YIELDS
A 2-year government bond pays roughly what investors expect the central bank's interest rate to average over the next two years. That makes the 2-year yield the market's running estimate of monetary policy:
• When traders expect more hikes (or fewer cuts), the 2-year yield rises.
• When they expect cuts, it falls.
Yields react to every data release, speech and central bank meeting, often before the decision itself. Research on the Federal Reserve (Gürkaynak, Sack & Swanson, 2005) shows that central bank communication about the future path of rates moves government bond yields, not only the decision on the day. (The exact meeting-by-meeting probabilities of a hike or cut are calculated from interest rate futures; the 2-year yield shows the overall expected path.)
WHY THE SPREAD BETWEEN TWO YIELDS MATTERS
A currency pair is a comparison of two economies, so what matters is not one country's rates but the gap between them. When the rate gap moves in a currency's favour, that currency tends to strengthen:
• Federal Reserve research (Curcuru, 2017) estimated that the US dollar rises roughly 2.5–5% against major currencies after a 1 percentage point surprise increase in expected US rates over the next two years.
• Academic work on exchange rates (Engel, NBER) finds that a currency tends to strengthen when its interest rates rise relative to other countries'.
• The New York Fed's own reports on foreign exchange operations have cited the US–German 2-year spread as a factor behind moves in EUR/USD.
In short: the level of the spread shows which currency offers higher expected rates; the change in the spread shows which way rate expectations are moving.
HOW BANKS AND FUNDS USE IT
Rate differentials are one of the main inputs professional FX desks track:
• Bank FX strategists build short-term "fair value" models for currency pairs, and the 2-year rate differential is a core input. ING, for example, lists 2-year swap rate differentials first among its model's drivers, alongside equities, the shape of the yield curve, risk sentiment and commodities.
• Rate differentials drive the carry trade — borrowing in low-yield currencies to invest in high-yield ones — which the Bank for International Settlements has documented among hedge funds and other investors.
• Professional desks often measure rate expectations with interest rate swaps; government bond yields move very closely with them and are the closest equivalent available on TradingView.
Important: the link between rates and currencies is not constant. Risk sentiment, energy prices, safe-haven flows and positioning can dominate for weeks (for example, during an energy shock a currency can fall even while its yields rise). The spread explains the rate story behind a pair — it is context for your analysis, not a buy or sell signal.
WHAT THE INDICATOR SHOWS
Two views (Settings → Display → Show):
• Spread — one line: base currency yield minus quote currency yield, in basis points (bp). Rising = rate expectations moving towards the base currency (supportive for the pair). Falling = moving towards the quote currency.
• Both yields — the two yields as separate lines, in %. The gap between them is the spread, and the line that is moving shows which country is driving it — for example whether a wider EUR/USD spread comes from US yields falling or German yields rising.
The table:
• Now — each yield and the spread right now (live).
• 1 day — change since each bond's previous close (so it always shows the latest full daily move, also in the evening and at weekends).
• 1 week — change over 5 trading days.
• 1 month — change over 21 trading days.
Spread changes are coloured: green = moving towards the base currency, red = towards the quote currency. Yield changes are neutral, because a rising yield helps one side of the pair and hurts the other.
YIELDS AND MATURITIES
Auto mode (default) picks the yields from the chart and switches when you change pairs:
USD → US, EUR → Germany, GBP → UK, JPY → Japan, CHF → Switzerland, CAD → Canada, AUD → Australia, NZD → New Zealand. This covers all 28 pairs between these eight currencies.
Why Germany for the euro: German bonds are the euro area's benchmark — the safest and most liquid euro government bonds — so their yields mostly reflect ECB rate expectations. Yields of other euro countries also include country-specific risk (government debt, politics), which would blur the rate signal.
Maturity (Auto mode):
• 2Y (default) — expected central bank rates over the next two years; the standard choice for rate expectations.
• 5Y — a mix of the rate path and the medium-term economic outlook.
• 10Y — long-term growth and inflation expectations, plus the extra yield investors demand for long-term government debt. A rising 10-year spread can reflect worries about government borrowing rather than central bank policy, so read it with care.
Manual mode lets you compare any two yields, whatever the chart — for example French 2Y vs German 2Y to see the political/fiscal risk premium inside the euro area.
DATA TIMING (NO REPAINTING)
Bond markets close at different times from forex (US bonds, for example, close after the forex day ends). If daily data were simply combined, a pair could be compared with a bond price from the previous day. Yield Spread FX matches each yield to the forex day by its trading date, using each bond's hourly data up to the forex close where needed, so both yields always belong to the same day.
• Daily and higher charts: today's values update live, like price; past values do not change.
• Intraday charts: the line shows the last completed day, so history never changes (no repainting). The table always shows today's live values.
• A yield that has not updated for more than 7 days is shown as "—" rather than an old number.
Data: TradingView TVC government bond yields (e.g. TVC:US02Y, TVC:DE02Y).
HOW TO USE IT
• Check whether the rate story supports your bias: is the spread moving towards or against the currency you want to buy?
• Use "Both yields" after a central bank meeting or a major data release to see which country's yields moved — is it a Fed story or an ECB story?
• Compare the spread with price. If the spread keeps moving one way and the pair goes the other, something other than rates (risk, energy, positioning) is driving the pair — worth finding out what.
• Weekly, daily and 4H charts suit it best, as the data is daily.
SETTINGS
• Yields: Mode (Auto / Manual), Maturity (2Y / 5Y / 10Y), First and second yield for Manual mode.
• Display: Spread or Both yields, line colour and width.
• Yield line colours: one colour per currency, plus two for Manual mode.
• Table: show/hide, position, text size, colours for spread changes.
Colours are readable on light and dark charts and can all be changed.
This indicator is for analysis and education only. It is not financial advice and does not generate trading signals.

คำจำกัดสิทธิ์ความรับผิดชอบ
ข้อมูลและบทความไม่ได้มีวัตถุประสงค์เพื่อก่อให้เกิดกิจกรรมทางการเงิน, การลงทุน, การซื้อขาย, ข้อเสนอแนะ หรือคำแนะนำประเภทอื่น ๆ ที่ให้หรือรับรองโดย TradingView อ่านเพิ่มเติมใน ข้อกำหนดการใช้งาน
คำจำกัดสิทธิ์ความรับผิดชอบ
ข้อมูลและบทความไม่ได้มีวัตถุประสงค์เพื่อก่อให้เกิดกิจกรรมทางการเงิน, การลงทุน, การซื้อขาย, ข้อเสนอแนะ หรือคำแนะนำประเภทอื่น ๆ ที่ให้หรือรับรองโดย TradingView อ่านเพิ่มเติมใน ข้อกำหนดการใช้งาน