Aurora Value Trend | Value Area Retest Strategy
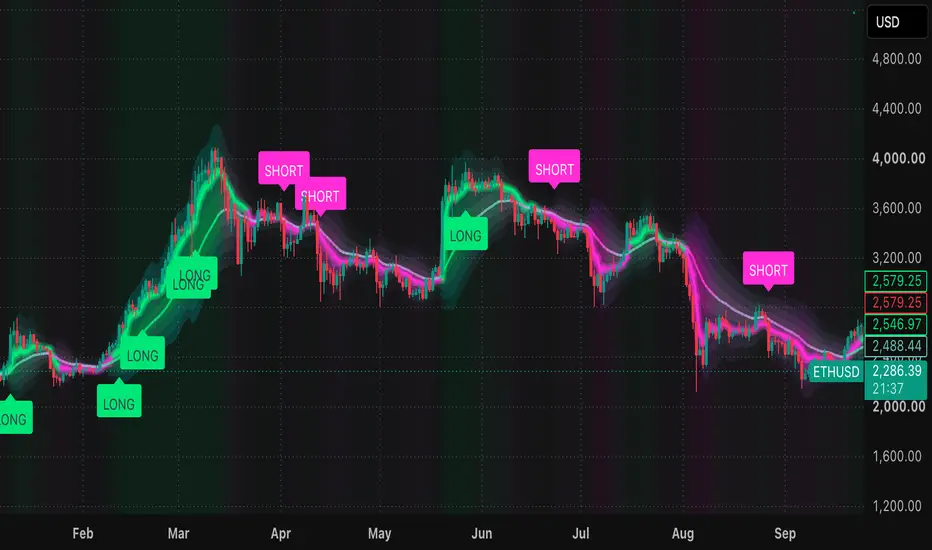
Aurora Value Trend trades retests of last week’s value area, but only in the direction of the prevailing trend and only when momentum agrees. Everything is drawn in a glowing aurora style so the trend, flow and energy are readable at a glance.
How the strategy works
Features
Settings
Setting What it does
Direction Both, long only or short only
Trend window Bars the filter looks back over
Trend reversal threshold How far the filter must retrace to flip the trend (higher = fewer flips)
Stop (x ATR) Stop distance
Target (R multiple) Take-profit as a multiple of the stop distance
Retest tolerance (x ATR) How close to the edge price must come to count as a retest
Tips
Use an intraday chart (15m to 4h) on liquid, volume-reporting markets. The weekly profile needs enough bars to be meaningful.
Give the chart at least a few weeks of history. The first week has no value area, so no trades fire until the second week.
A higher reversal threshold gives fewer, longer trades. A lower one is faster but flips more often.
If the chart feels busy, switch off the aurora, the gradient or candle painting. None of them affect the trades.
Test different stop and target pairs on your own market. The defaults are starting points, not optimised values.
Warnings
How the strategy works
- Location: At each weekly rollover, the script builds a volume profile of the week that just ended and extracts three levels: the value area high (VAH), the value area low (VAL), and the point of control (POC). The value area is the zone holding 70% of the week’s traded volume. These levels carry forward through the new week.
- Direction: An adaptive bilateral filter smooths price, weighting each bar by both its recency and its price distance from the current level. After a breakout it moves to the new level quickly instead of lagging like a moving average. The trend flips only when the filter retraces a volatility-scaled distance from its extreme, which reduces whipsaws.
- Flow confirmation: A blend of fast and slow flow (price distance from two EMAs, measured in ATR) must agree with the trade side. Longs need positive flow, shorts need negative flow.
- Entry:
- Long: the trend is up, flow is bullish, and price dips back to VAH and closes above it on a green candle.
- Short: the trend is down, flow is bearish, and price pokes up to VAL and closes below it on a red candle.
- Exit: an ATR-based stop and an R-multiple target, or an early exit if the trend flips against the position.
Features
- Weekly value area calculated from real traded volume (levels are tracked internally and shown in the panel)
- Adaptive bilateral-filter trend line with glow
- Price gradient that fades from the trend line toward price
- Aurora curtain whose width follows market energy and whose colour follows flow direction
- Optional candle painting by trend and a sky-glow background
- Compact stats panel: position, price vs value area, trend, flow, energy, VAH / VAL / POC
- Long only, short only or both
- Alerts on entries via the strategy
Settings
Setting What it does
Direction Both, long only or short only
Trend window Bars the filter looks back over
Trend reversal threshold How far the filter must retrace to flip the trend (higher = fewer flips)
Stop (x ATR) Stop distance
Target (R multiple) Take-profit as a multiple of the stop distance
Retest tolerance (x ATR) How close to the edge price must come to count as a retest
Tips
Use an intraday chart (15m to 4h) on liquid, volume-reporting markets. The weekly profile needs enough bars to be meaningful.
Give the chart at least a few weeks of history. The first week has no value area, so no trades fire until the second week.
A higher reversal threshold gives fewer, longer trades. A lower one is faster but flips more often.
If the chart feels busy, switch off the aurora, the gradient or candle painting. None of them affect the trades.
Test different stop and target pairs on your own market. The defaults are starting points, not optimised values.
Warnings
- This is not financial advice. Backtests are not a guarantee of future results.
- Defaults assume 10% of equity per trade, 0.05% commission and 2 ticks of slippage. Adjust these to match your broker and instrument, and avoid risking more than you can afford to lose.
- Entry conditions are strict, so trade counts can be low on some symbols and timeframes. A small sample is not statistically reliable.
- Instruments with no or unreliable volume data will produce meaningless value areas.
- Entries fill at the next bar’s open, so real fills may differ from the signal candle’s close.
- Backtest results depend on how much history your plan loads. Different history lengths can change the weekly levels, and therefore the trades.

คำจำกัดสิทธิ์ความรับผิดชอบ
ข้อมูลและบทความไม่ได้มีวัตถุประสงค์เพื่อก่อให้เกิดกิจกรรมทางการเงิน, การลงทุน, การซื้อขาย, ข้อเสนอแนะ หรือคำแนะนำประเภทอื่น ๆ ที่ให้หรือรับรองโดย TradingView อ่านเพิ่มเติมใน ข้อกำหนดการใช้งาน
คำจำกัดสิทธิ์ความรับผิดชอบ
ข้อมูลและบทความไม่ได้มีวัตถุประสงค์เพื่อก่อให้เกิดกิจกรรมทางการเงิน, การลงทุน, การซื้อขาย, ข้อเสนอแนะ หรือคำแนะนำประเภทอื่น ๆ ที่ให้หรือรับรองโดย TradingView อ่านเพิ่มเติมใน ข้อกำหนดการใช้งาน