Liquidity Orbs 3D [Neblok]
Liquidity Orbs 3D [Neblok]
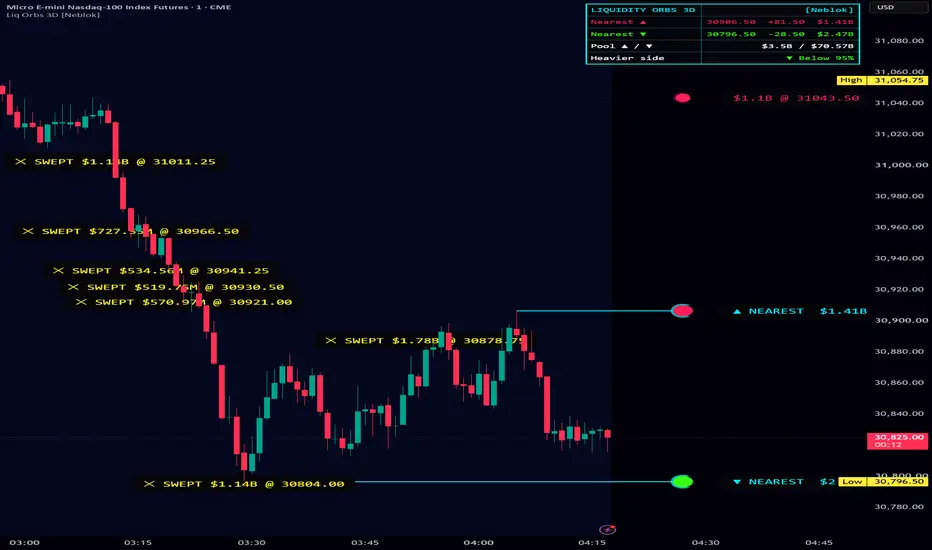
Liquidity Orbs 3D maps where resting liquidity is likely sitting on your chart — above swing highs and below swing lows — and shows how much money actually traded while each of those swings formed. Every level is drawn as a neon orb to the right of price, sized by its traded value, with a clear label showing the value, the price, and how far away it is. When price trades through a level, it is removed automatically and marked as swept.
This is a free, open-source script.
━━━━━━━━━━━━━━━━━━━━
WHAT IT SHOWS
━━━━━━━━━━━━━━━━━━━━
- Red orbs = liquidity levels ABOVE current price (built from swing highs)
- Green orbs = liquidity levels BELOW current price (built from swing lows)
- Cyan ring + solid line + "NEAREST" tag = the closest level on each side
- Orb size = how heavy that level is compared to the other visible levels. The largest orb on screen is the heaviest pool.
- Yellow "✕ SWEPT" marker = a level that price has already run through
Each label reads like this:
▲ NEAREST $822.88M @ 24,987.00 +5.50
→ traded value, level price, distance from current price
━━━━━━━━━━━━━━━━━━━━
HOW THE LEVELS ARE BUILT
━━━━━━━━━━━━━━━━━━━━
1. The script finds confirmed swing highs and swing lows using pivot logic (left and right bars).
2. For each swing, it adds up the value traded across the bars that formed it. In "Notional $" mode this is volume × price × the contract's point value, so futures like MNQ, MES, NQ and ES show real dollar amounts. In "Contracts" mode it uses raw volume.
3. That value is compared to the recent average swing. Swings below the minimum strength are ignored, so only meaningful levels stay on the chart.
4. Levels on the same side that sit very close together are merged into a single pool. Their values are combined, and the level keeps the more extreme price. This prevents stacked, unreadable labels.
5. A level stays on the chart until price trades through it. Then it is deleted and a swept marker is left behind.
Note: a swing is only confirmed after the "Pivot right bars" number of bars has passed. New levels therefore appear a few bars after the actual high or low. This is normal and prevents levels from repainting.
━━━━━━━━━━━━━━━━━━━━
HOW TO USE IT
━━━━━━━━━━━━━━━━━━━━
- Targets: The nearest orb in the direction of your trade is a logical area where price may be drawn to. Large orbs are often the more meaningful magnets.
- Stop awareness: Avoid placing stops just beyond a heavy orb. Those areas are where resting stops tend to cluster and where sweeps commonly happen.
- Sweep reactions: When a large orb gets swept and price quickly returns back inside the range, that can signal a stop run rather than a true breakout. Use the yellow SWEPT markers to spot these.
- Imbalance: The HUD shows the total liquidity above vs. below price. A heavily one-sided reading tells you where the larger pool of resting orders sits.
- Confluence: This works best combined with your own structure, session levels, or entry model. It is a map of where liquidity sits, not a buy or sell signal on its own.
━━━━━━━━━━━━━━━━━━━━
THE HUD (TABLE)
━━━━━━━━━━━━━━━━━━━━
- Nearest ▲ / ▼ — price, distance, and value of the closest level on each side
- Pool ▲ / ▼ — total value of all active levels above and below price
- Heavier side — which side holds more liquidity, as a percentage
━━━━━━━━━━━━━━━━━━━━
SETTINGS GUIDE
━━━━━━━━━━━━━━━━━━━━
DETECTION
- Pivot left / right bars — Swing sensitivity. Higher values = fewer, more significant swings. Right bars also sets the confirmation delay.
- Size orbs by — Notional $ (volume × price × point value) or Contracts.
- Strength baseline length — How many swings are used to calculate the "average" swing value.
- Min strength (× baseline) — Filter. 1.0 keeps only above-average swings. Raise it for a cleaner chart; lower it to see more levels.
- Merge nearby levels (× ATR) — How close two levels must be to combine. Raise it if labels still overlap.
- Max levels kept in memory — Upper limit on stored levels.
- Expire levels after N bars — Removes old levels that were never swept. 0 = never expire.
DISPLAY
- Levels shown above / below price — How many of the nearest levels to draw on each side.
- Orb style — 3D (glow ring, drop shadow, highlight) or Flat.
- Orb distance right of last bar — How far into the future the orbs sit.
- 3D highlight lift — Moves the white highlight on each orb. Adjust this if it looks off-center at your zoom level.
- Draw level lines / Show value labels / Show distance from price — Turn each element on or off.
- Label text size / Label gap from orb — Readability controls.
NEON COLORS
- Separate colors for levels above, levels below, the nearest accent, swept markers, and the label/HUD background.
SWEEPS & ALERTS
- Sweep trigger — Wick (any trade through the level) or Close (a candle must close through it).
- Mark swept levels / Swept markers kept — Controls the yellow sweep markers.
- Alert only if strength ≥ — Only alert on sweeps of levels at or above this strength. 0 = alert on all sweeps.
HUD
- Show HUD, position, and text size.
━━━━━━━━━━━━━━━━━━━━
ALERTS
━━━━━━━━━━━━━━━━━━━━
Create an alert and choose one of these:
- "Any alert() function call" — detailed message with the symbol, level value, and price that was swept (fires on bar close)
- "Liquidity above swept"
- "Liquidity below swept"
━━━━━━━━━━━━━━━━━━━━
TIPS
━━━━━━━━━━━━━━━━━━━━
- Works on any symbol with volume data. On symbols without volume, orbs are still drawn but all have equal size.
- On 1–5 minute futures charts, the default settings are a good starting point. On higher timeframes, try raising the pivot bars.
- If the chart looks busy, raise "Min strength" or lower the number of levels shown per side.
- Hover over any orb or label to see a tooltip with its value, price, strength, and age.
━━━━━━━━━━━━━━━━━━━━
DISCLAIMER
━━━━━━━━━━━━━━━━━━━━
This script is provided for educational and informational purposes only. It is not financial advice, investment advice, or a recommendation to buy or sell any security, futures contract, or other financial instrument.
Liquidity levels show where orders may be resting based on past price and volume. They do not predict future price movement, and price can move through, ignore, or reverse at any level.
Trading futures, options, stocks, and other leveraged products involves substantial risk of loss and is not suitable for every investor. You can lose more than your initial investment. Past performance is not indicative of future results.
Always do your own research, test any tool before using it with real money, and consult a licensed financial professional before making trading decisions. The author is not responsible for any losses resulting from the use of this script.
Liquidity Orbs 3D maps where resting liquidity is likely sitting on your chart — above swing highs and below swing lows — and shows how much money actually traded while each of those swings formed. Every level is drawn as a neon orb to the right of price, sized by its traded value, with a clear label showing the value, the price, and how far away it is. When price trades through a level, it is removed automatically and marked as swept.
This is a free, open-source script.
━━━━━━━━━━━━━━━━━━━━
WHAT IT SHOWS
━━━━━━━━━━━━━━━━━━━━
- Red orbs = liquidity levels ABOVE current price (built from swing highs)
- Green orbs = liquidity levels BELOW current price (built from swing lows)
- Cyan ring + solid line + "NEAREST" tag = the closest level on each side
- Orb size = how heavy that level is compared to the other visible levels. The largest orb on screen is the heaviest pool.
- Yellow "✕ SWEPT" marker = a level that price has already run through
Each label reads like this:
▲ NEAREST $822.88M @ 24,987.00 +5.50
→ traded value, level price, distance from current price
━━━━━━━━━━━━━━━━━━━━
HOW THE LEVELS ARE BUILT
━━━━━━━━━━━━━━━━━━━━
1. The script finds confirmed swing highs and swing lows using pivot logic (left and right bars).
2. For each swing, it adds up the value traded across the bars that formed it. In "Notional $" mode this is volume × price × the contract's point value, so futures like MNQ, MES, NQ and ES show real dollar amounts. In "Contracts" mode it uses raw volume.
3. That value is compared to the recent average swing. Swings below the minimum strength are ignored, so only meaningful levels stay on the chart.
4. Levels on the same side that sit very close together are merged into a single pool. Their values are combined, and the level keeps the more extreme price. This prevents stacked, unreadable labels.
5. A level stays on the chart until price trades through it. Then it is deleted and a swept marker is left behind.
Note: a swing is only confirmed after the "Pivot right bars" number of bars has passed. New levels therefore appear a few bars after the actual high or low. This is normal and prevents levels from repainting.
━━━━━━━━━━━━━━━━━━━━
HOW TO USE IT
━━━━━━━━━━━━━━━━━━━━
- Targets: The nearest orb in the direction of your trade is a logical area where price may be drawn to. Large orbs are often the more meaningful magnets.
- Stop awareness: Avoid placing stops just beyond a heavy orb. Those areas are where resting stops tend to cluster and where sweeps commonly happen.
- Sweep reactions: When a large orb gets swept and price quickly returns back inside the range, that can signal a stop run rather than a true breakout. Use the yellow SWEPT markers to spot these.
- Imbalance: The HUD shows the total liquidity above vs. below price. A heavily one-sided reading tells you where the larger pool of resting orders sits.
- Confluence: This works best combined with your own structure, session levels, or entry model. It is a map of where liquidity sits, not a buy or sell signal on its own.
━━━━━━━━━━━━━━━━━━━━
THE HUD (TABLE)
━━━━━━━━━━━━━━━━━━━━
- Nearest ▲ / ▼ — price, distance, and value of the closest level on each side
- Pool ▲ / ▼ — total value of all active levels above and below price
- Heavier side — which side holds more liquidity, as a percentage
━━━━━━━━━━━━━━━━━━━━
SETTINGS GUIDE
━━━━━━━━━━━━━━━━━━━━
DETECTION
- Pivot left / right bars — Swing sensitivity. Higher values = fewer, more significant swings. Right bars also sets the confirmation delay.
- Size orbs by — Notional $ (volume × price × point value) or Contracts.
- Strength baseline length — How many swings are used to calculate the "average" swing value.
- Min strength (× baseline) — Filter. 1.0 keeps only above-average swings. Raise it for a cleaner chart; lower it to see more levels.
- Merge nearby levels (× ATR) — How close two levels must be to combine. Raise it if labels still overlap.
- Max levels kept in memory — Upper limit on stored levels.
- Expire levels after N bars — Removes old levels that were never swept. 0 = never expire.
DISPLAY
- Levels shown above / below price — How many of the nearest levels to draw on each side.
- Orb style — 3D (glow ring, drop shadow, highlight) or Flat.
- Orb distance right of last bar — How far into the future the orbs sit.
- 3D highlight lift — Moves the white highlight on each orb. Adjust this if it looks off-center at your zoom level.
- Draw level lines / Show value labels / Show distance from price — Turn each element on or off.
- Label text size / Label gap from orb — Readability controls.
NEON COLORS
- Separate colors for levels above, levels below, the nearest accent, swept markers, and the label/HUD background.
SWEEPS & ALERTS
- Sweep trigger — Wick (any trade through the level) or Close (a candle must close through it).
- Mark swept levels / Swept markers kept — Controls the yellow sweep markers.
- Alert only if strength ≥ — Only alert on sweeps of levels at or above this strength. 0 = alert on all sweeps.
HUD
- Show HUD, position, and text size.
━━━━━━━━━━━━━━━━━━━━
ALERTS
━━━━━━━━━━━━━━━━━━━━
Create an alert and choose one of these:
- "Any alert() function call" — detailed message with the symbol, level value, and price that was swept (fires on bar close)
- "Liquidity above swept"
- "Liquidity below swept"
━━━━━━━━━━━━━━━━━━━━
TIPS
━━━━━━━━━━━━━━━━━━━━
- Works on any symbol with volume data. On symbols without volume, orbs are still drawn but all have equal size.
- On 1–5 minute futures charts, the default settings are a good starting point. On higher timeframes, try raising the pivot bars.
- If the chart looks busy, raise "Min strength" or lower the number of levels shown per side.
- Hover over any orb or label to see a tooltip with its value, price, strength, and age.
━━━━━━━━━━━━━━━━━━━━
DISCLAIMER
━━━━━━━━━━━━━━━━━━━━
This script is provided for educational and informational purposes only. It is not financial advice, investment advice, or a recommendation to buy or sell any security, futures contract, or other financial instrument.
Liquidity levels show where orders may be resting based on past price and volume. They do not predict future price movement, and price can move through, ignore, or reverse at any level.
Trading futures, options, stocks, and other leveraged products involves substantial risk of loss and is not suitable for every investor. You can lose more than your initial investment. Past performance is not indicative of future results.
Always do your own research, test any tool before using it with real money, and consult a licensed financial professional before making trading decisions. The author is not responsible for any losses resulting from the use of this script.

คำจำกัดสิทธิ์ความรับผิดชอบ
ข้อมูลและบทความไม่ได้มีวัตถุประสงค์เพื่อก่อให้เกิดกิจกรรมทางการเงิน, การลงทุน, การซื้อขาย, ข้อเสนอแนะ หรือคำแนะนำประเภทอื่น ๆ ที่ให้หรือรับรองโดย TradingView อ่านเพิ่มเติมใน ข้อกำหนดการใช้งาน
คำจำกัดสิทธิ์ความรับผิดชอบ
ข้อมูลและบทความไม่ได้มีวัตถุประสงค์เพื่อก่อให้เกิดกิจกรรมทางการเงิน, การลงทุน, การซื้อขาย, ข้อเสนอแนะ หรือคำแนะนำประเภทอื่น ๆ ที่ให้หรือรับรองโดย TradingView อ่านเพิ่มเติมใน ข้อกำหนดการใช้งาน