Bull & Bear Volume Bubbles [FEELS]
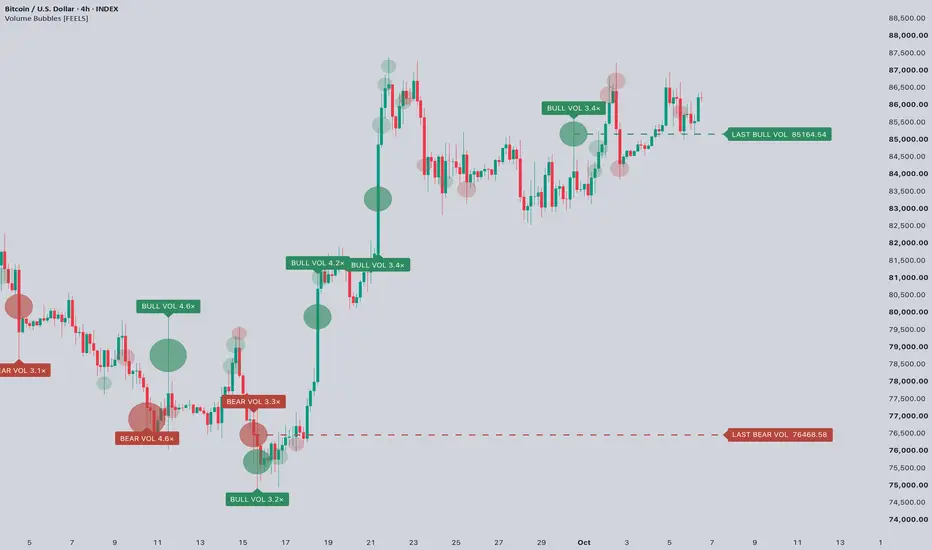
Where did heavy buying last trade, and where did heavy selling? Two lines, and the bubbles that put them there.
Every bar with unusual volume gets a bubble. The bigger the volume compared with the bars before it, the bigger the bubble. The script looks inside each bar through a lower timeframe, puts the bubble at the price where most of that bar's volume changed hands, and colours it by whether up-volume or down-volume was larger. Heavy bars that come in a run are grouped into one wave with one tag, and two lines keep the price of the last heavy bull bar and the last heavy bear bar on the chart.
What makes it different: heavy volume rarely comes alone. Instead of a bubble and a label on every bar of a run, heavy bars of the same colour close together are one wave: one tag on its biggest bar, with the count, and only that bubble at full strength. Two lines keep the price where the last heavy bull bar and the last heavy bear bar traded, so price above both, below both or between them reads at a glance. Each bubble sits at the price where most of its bar's volume traded, read from a lower timeframe.
ETH/USD, 1D. The June low came as one bear wave of two heavy bars, tagged once. The August breakout is a bull wave of two, and price now trades above both lines.

FEATURES
- A bubble on every bar with volume at least 1.5× the average of the 50 bars before it. Four sizes: from 1.5×, 2.2×, 3× and 4.5×.
- Bubble placed at the price where most of the bar's volume traded, read from a lower timeframe.
- Bubble coloured by up-volume against down-volume inside the bar.
- Heavy bars (3× and up) at full strength, the rest faded.
- Heavy bars of the same colour close together form one wave: one tag on its biggest bar, such as BULL VOL 4.5× · 4 bars, and only that bubble stays at full strength.
- Two lines: the price of the last heavy bull bar and of the last heavy bear bar.
- Hover a bubble to see its volume multiple, the up and down split, and the price where most volume traded.
- An optional panel with both lines and how far the current price is from each.
- Five alerts, all on bar close: heavy bull volume, heavy bear volume, heavy volume either side, close above the last bear line, close below the last bull line.
- Every threshold, word, colour, fade and line style can be changed.
HOW IT WORKS
Size. A bar's volume is divided by the average volume of the 50 bars before it. The bar itself is left out of the average, so a spike can't raise its own yardstick. From 1.5× the bar gets a bubble, and from 3× it counts as heavy.
Place. The script reads the bar through a lower timeframe: 1h bars inside a daily bar, 15m inside 4h, 5m inside 1h, 1m inside 15m. It finds the lower-timeframe bar that carried the most volume and puts the bubble at that bar's price. On a long candle this is often near one end of it, not in the middle.
Colour. Inside the same bar, the volume of lower-timeframe bars that closed up is added up, and so is the volume of those that closed down. Green when up-volume is larger, red when down-volume is.
Waves. Heavy volume rarely comes alone. Heavy bars of the same colour no more than 15 bars apart are one wave. The wave gets one tag, on its biggest bar, on the side of the candle where that bubble sits. The count in the tag is the number of heavy bars in the wave. If two tags would land on the same side within 8 bars, they are split: a bull and a bear tag go above and below by which bubble is higher, and of two same-colour tags the newer one moves to the other side.
Lines. The two lines start at the bubble of the last heavy bull bar and the last heavy bear bar and run to the right edge, with their price.
Everything, alerts included, is decided on closed bars. A bubble, once drawn, does not move. A wave's tag can still move to a bigger bar while the wave is running.
NVDA, 4h. The last heavy bear bar left a line at 191.24. Price came back to it through the summer, then moved above both lines.

HOW TO READ IT
1. Big bubble, big volume. Size is always relative to the bars before it, not an absolute number.
2. Green bubble: more volume went through on rising lower-timeframe bars. Red: on falling ones. The candle colour can disagree with the bubble, and that disagreement is the information.
3. The position of the bubble inside the candle is where the volume traded. A bubble at the bottom of a long red candle means most of the selling happened near the low.
4. One tag per wave. BEAR VOL 4.7× · 4 bars means four heavy red bars close together, the biggest at 4.7× the average.
5. The two lines show where heavy buying and heavy selling last traded. Price above both, below both, or between them is a quick read of who last showed up in size.
6. Faded bubbles are ordinary above-average volume, and the faded heavy ones belong to a wave whose biggest bubble is elsewhere.
SOL/USDT, 30m. Intraday. Price trades between the two lines: under the last heavy bull bar, above the last heavy bear bar.

SETTINGS WORTH KNOWING
- Heavy from, × average: 3 by default. Raise it to keep only the biggest volume.
- Show bubbles under the heavy level: turn off to see heavy volume only.
- Bubble sits and Colour by: switch back to the middle of the bar and to where the bar closed, if you prefer the classic reading.
- Pick the lower timeframe automatically: off lets you choose it yourself.
- In a wave, only the biggest bubble at full strength: off shows every heavy bubble at full strength.
- Same-colour heavy bars this close are one wave, bars: 15 by default. Lower it for more, shorter waves.
- Show the panel: off by default.
HONESTY
Up-volume and down-volume are added up from lower-timeframe bars that closed up or down. That is an approximation of buying and selling, not real order flow.
TradingView keeps lower-timeframe history for a limited number of bars. Further back, the bubble falls back to the middle of the bar (high + low + close ÷ 3) and its colour to where the bar closed in its range. On a chart timeframe under 15 minutes the bar itself is used the same way.
Heavy volume says that something happened, not what happens next. The script does not forecast and does not score itself.
Symbols without volume data draw nothing and say so.
Open source. Read it, change it, and tell me if something is wrong.
Every bar with unusual volume gets a bubble. The bigger the volume compared with the bars before it, the bigger the bubble. The script looks inside each bar through a lower timeframe, puts the bubble at the price where most of that bar's volume changed hands, and colours it by whether up-volume or down-volume was larger. Heavy bars that come in a run are grouped into one wave with one tag, and two lines keep the price of the last heavy bull bar and the last heavy bear bar on the chart.
What makes it different: heavy volume rarely comes alone. Instead of a bubble and a label on every bar of a run, heavy bars of the same colour close together are one wave: one tag on its biggest bar, with the count, and only that bubble at full strength. Two lines keep the price where the last heavy bull bar and the last heavy bear bar traded, so price above both, below both or between them reads at a glance. Each bubble sits at the price where most of its bar's volume traded, read from a lower timeframe.
ETH/USD, 1D. The June low came as one bear wave of two heavy bars, tagged once. The August breakout is a bull wave of two, and price now trades above both lines.
FEATURES
- A bubble on every bar with volume at least 1.5× the average of the 50 bars before it. Four sizes: from 1.5×, 2.2×, 3× and 4.5×.
- Bubble placed at the price where most of the bar's volume traded, read from a lower timeframe.
- Bubble coloured by up-volume against down-volume inside the bar.
- Heavy bars (3× and up) at full strength, the rest faded.
- Heavy bars of the same colour close together form one wave: one tag on its biggest bar, such as BULL VOL 4.5× · 4 bars, and only that bubble stays at full strength.
- Two lines: the price of the last heavy bull bar and of the last heavy bear bar.
- Hover a bubble to see its volume multiple, the up and down split, and the price where most volume traded.
- An optional panel with both lines and how far the current price is from each.
- Five alerts, all on bar close: heavy bull volume, heavy bear volume, heavy volume either side, close above the last bear line, close below the last bull line.
- Every threshold, word, colour, fade and line style can be changed.
HOW IT WORKS
Size. A bar's volume is divided by the average volume of the 50 bars before it. The bar itself is left out of the average, so a spike can't raise its own yardstick. From 1.5× the bar gets a bubble, and from 3× it counts as heavy.
Place. The script reads the bar through a lower timeframe: 1h bars inside a daily bar, 15m inside 4h, 5m inside 1h, 1m inside 15m. It finds the lower-timeframe bar that carried the most volume and puts the bubble at that bar's price. On a long candle this is often near one end of it, not in the middle.
Colour. Inside the same bar, the volume of lower-timeframe bars that closed up is added up, and so is the volume of those that closed down. Green when up-volume is larger, red when down-volume is.
Waves. Heavy volume rarely comes alone. Heavy bars of the same colour no more than 15 bars apart are one wave. The wave gets one tag, on its biggest bar, on the side of the candle where that bubble sits. The count in the tag is the number of heavy bars in the wave. If two tags would land on the same side within 8 bars, they are split: a bull and a bear tag go above and below by which bubble is higher, and of two same-colour tags the newer one moves to the other side.
Lines. The two lines start at the bubble of the last heavy bull bar and the last heavy bear bar and run to the right edge, with their price.
Everything, alerts included, is decided on closed bars. A bubble, once drawn, does not move. A wave's tag can still move to a bigger bar while the wave is running.
NVDA, 4h. The last heavy bear bar left a line at 191.24. Price came back to it through the summer, then moved above both lines.
HOW TO READ IT
1. Big bubble, big volume. Size is always relative to the bars before it, not an absolute number.
2. Green bubble: more volume went through on rising lower-timeframe bars. Red: on falling ones. The candle colour can disagree with the bubble, and that disagreement is the information.
3. The position of the bubble inside the candle is where the volume traded. A bubble at the bottom of a long red candle means most of the selling happened near the low.
4. One tag per wave. BEAR VOL 4.7× · 4 bars means four heavy red bars close together, the biggest at 4.7× the average.
5. The two lines show where heavy buying and heavy selling last traded. Price above both, below both, or between them is a quick read of who last showed up in size.
6. Faded bubbles are ordinary above-average volume, and the faded heavy ones belong to a wave whose biggest bubble is elsewhere.
SOL/USDT, 30m. Intraday. Price trades between the two lines: under the last heavy bull bar, above the last heavy bear bar.
SETTINGS WORTH KNOWING
- Heavy from, × average: 3 by default. Raise it to keep only the biggest volume.
- Show bubbles under the heavy level: turn off to see heavy volume only.
- Bubble sits and Colour by: switch back to the middle of the bar and to where the bar closed, if you prefer the classic reading.
- Pick the lower timeframe automatically: off lets you choose it yourself.
- In a wave, only the biggest bubble at full strength: off shows every heavy bubble at full strength.
- Same-colour heavy bars this close are one wave, bars: 15 by default. Lower it for more, shorter waves.
- Show the panel: off by default.
HONESTY
Up-volume and down-volume are added up from lower-timeframe bars that closed up or down. That is an approximation of buying and selling, not real order flow.
TradingView keeps lower-timeframe history for a limited number of bars. Further back, the bubble falls back to the middle of the bar (high + low + close ÷ 3) and its colour to where the bar closed in its range. On a chart timeframe under 15 minutes the bar itself is used the same way.
Heavy volume says that something happened, not what happens next. The script does not forecast and does not score itself.
Symbols without volume data draw nothing and say so.
Open source. Read it, change it, and tell me if something is wrong.

💰Free Channel — t.me/FeelsStrategy
🤵For more info contact — t.me/VolodymyrFeels
🔗 Links — feelsstrategy.com/links
🤵For more info contact — t.me/VolodymyrFeels
🔗 Links — feelsstrategy.com/links
คำจำกัดสิทธิ์ความรับผิดชอบ
ข้อมูลและบทความไม่ได้มีวัตถุประสงค์เพื่อก่อให้เกิดกิจกรรมทางการเงิน, การลงทุน, การซื้อขาย, ข้อเสนอแนะ หรือคำแนะนำประเภทอื่น ๆ ที่ให้หรือรับรองโดย TradingView อ่านเพิ่มเติมใน ข้อกำหนดการใช้งาน
💰Free Channel — t.me/FeelsStrategy
🤵For more info contact — t.me/VolodymyrFeels
🔗 Links — feelsstrategy.com/links
🤵For more info contact — t.me/VolodymyrFeels
🔗 Links — feelsstrategy.com/links
คำจำกัดสิทธิ์ความรับผิดชอบ
ข้อมูลและบทความไม่ได้มีวัตถุประสงค์เพื่อก่อให้เกิดกิจกรรมทางการเงิน, การลงทุน, การซื้อขาย, ข้อเสนอแนะ หรือคำแนะนำประเภทอื่น ๆ ที่ให้หรือรับรองโดย TradingView อ่านเพิ่มเติมใน ข้อกำหนดการใช้งาน