OPEN-SOURCE SCRIPT
Developing FAB4 Zone
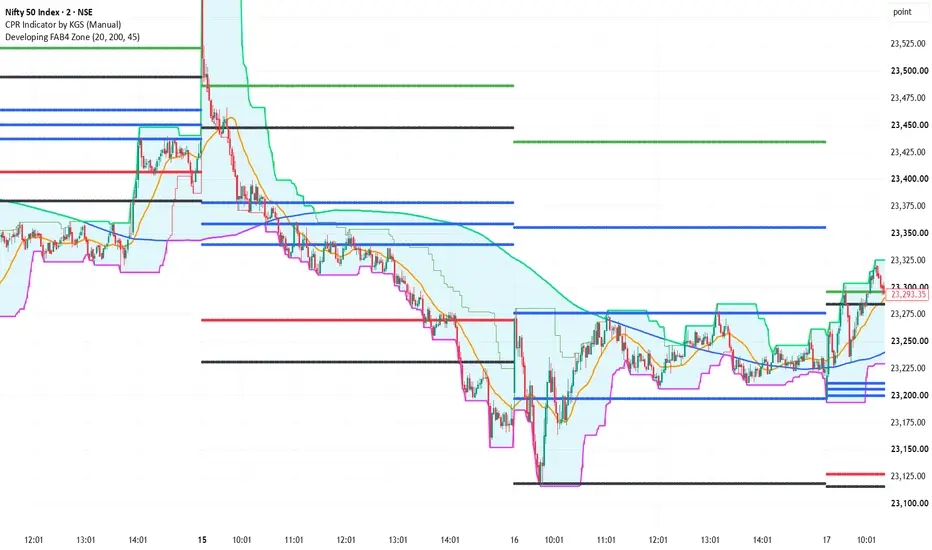
# Developing FAB4 Zone — Indicator Documentation
## Overview
The Developing FAB4 Zone is a TradingView indicator designed to visualize a dynamic price zone using four key reference elements: the 20 SMA, 200 SMA, current day's closing price, and the high and low of the last 45 minutes.
## Calculation Logic
- **20 SMA:** Identifies the short-term trend.
- **200 SMA:** Provides a longer-term trend reference.
- **Current day's closing price:** Uses the latest available price/close during the ongoing session.
- **Last 45-minute high and low:** Tracks the highest and lowest prices over a rolling 45-minute window. On a 2-minute chart, this uses 23 candles (approximately 46 minutes).
## Zone Formation
- **Zone High:** The highest value among the 20 SMA, 200 SMA, current price, and rolling 45-minute high.
- **Zone Low:** The lowest value among the 20 SMA, 200 SMA, current price, and rolling 45-minute low.
The zone updates as market conditions change, allowing traders to observe shifts in price structure and key reference levels.
## Intended Use
The indicator is intended to help traders visualize dynamic support and resistance areas, monitor price relative to moving averages, and identify potential breakout or rejection zones.
**Note:** This is a custom interpretation of the FAB4 concept, not a verified reproduction of Oliver Velez's exact trading rules. The indicator provides visual reference levels and does not independently generate trade signals.
## Overview
The Developing FAB4 Zone is a TradingView indicator designed to visualize a dynamic price zone using four key reference elements: the 20 SMA, 200 SMA, current day's closing price, and the high and low of the last 45 minutes.
## Calculation Logic
- **20 SMA:** Identifies the short-term trend.
- **200 SMA:** Provides a longer-term trend reference.
- **Current day's closing price:** Uses the latest available price/close during the ongoing session.
- **Last 45-minute high and low:** Tracks the highest and lowest prices over a rolling 45-minute window. On a 2-minute chart, this uses 23 candles (approximately 46 minutes).
## Zone Formation
- **Zone High:** The highest value among the 20 SMA, 200 SMA, current price, and rolling 45-minute high.
- **Zone Low:** The lowest value among the 20 SMA, 200 SMA, current price, and rolling 45-minute low.
The zone updates as market conditions change, allowing traders to observe shifts in price structure and key reference levels.
## Intended Use
The indicator is intended to help traders visualize dynamic support and resistance areas, monitor price relative to moving averages, and identify potential breakout or rejection zones.
**Note:** This is a custom interpretation of the FAB4 concept, not a verified reproduction of Oliver Velez's exact trading rules. The indicator provides visual reference levels and does not independently generate trade signals.
สคริปต์แบบโอเพนซอร์ส
ด้วยเจตนารมณ์หลักของ TradingView ผู้สร้างสคริปต์นี้ได้ทำให้เป็นโอเพนซอร์ส เพื่อให้เทรดเดอร์สามารถตรวจสอบและยืนยันฟังก์ชันการทำงานของมันได้ ขอชื่นชมผู้เขียน! แม้ว่าคุณจะใช้งานได้ฟรี แต่โปรดจำไว้ว่าการเผยแพร่โค้ดซ้ำจะต้องเป็นไปตาม กฎระเบียบการใช้งาน ของเรา

คำจำกัดสิทธิ์ความรับผิดชอบ
ข้อมูลและบทความไม่ได้มีวัตถุประสงค์เพื่อก่อให้เกิดกิจกรรมทางการเงิน, การลงทุน, การซื้อขาย, ข้อเสนอแนะ หรือคำแนะนำประเภทอื่น ๆ ที่ให้หรือรับรองโดย TradingView อ่านเพิ่มเติมใน ข้อกำหนดการใช้งาน
สคริปต์แบบโอเพนซอร์ส
ด้วยเจตนารมณ์หลักของ TradingView ผู้สร้างสคริปต์นี้ได้ทำให้เป็นโอเพนซอร์ส เพื่อให้เทรดเดอร์สามารถตรวจสอบและยืนยันฟังก์ชันการทำงานของมันได้ ขอชื่นชมผู้เขียน! แม้ว่าคุณจะใช้งานได้ฟรี แต่โปรดจำไว้ว่าการเผยแพร่โค้ดซ้ำจะต้องเป็นไปตาม กฎระเบียบการใช้งาน ของเรา
คำจำกัดสิทธิ์ความรับผิดชอบ
ข้อมูลและบทความไม่ได้มีวัตถุประสงค์เพื่อก่อให้เกิดกิจกรรมทางการเงิน, การลงทุน, การซื้อขาย, ข้อเสนอแนะ หรือคำแนะนำประเภทอื่น ๆ ที่ให้หรือรับรองโดย TradingView อ่านเพิ่มเติมใน ข้อกำหนดการใช้งาน