Machine Learning Fibonacci Extensions [FEELS]
How far did moves like this one run, on this chart? Fibonacci extension targets that answer from the chart's own history.
Draw a trend-based fib extension and you get a row of targets with nothing to choose between them. This script draws the extensions on the setup in play, a leg A to B and a pullback to C, then finds the past setups on the same chart that were most like it. Each of them puts one dot on the highest extension its next leg really reached. The level with the most dots is marked ML TARGET. The similar past moves are framed on the chart with A, B, C and TARGET, so you can check every one of them yourself.
What makes it different: an ordinary extension treats 1.272 and 2.618 the same. Here every level shows how many of this chart's own similar moves stopped there, and the evidence is on the chart.
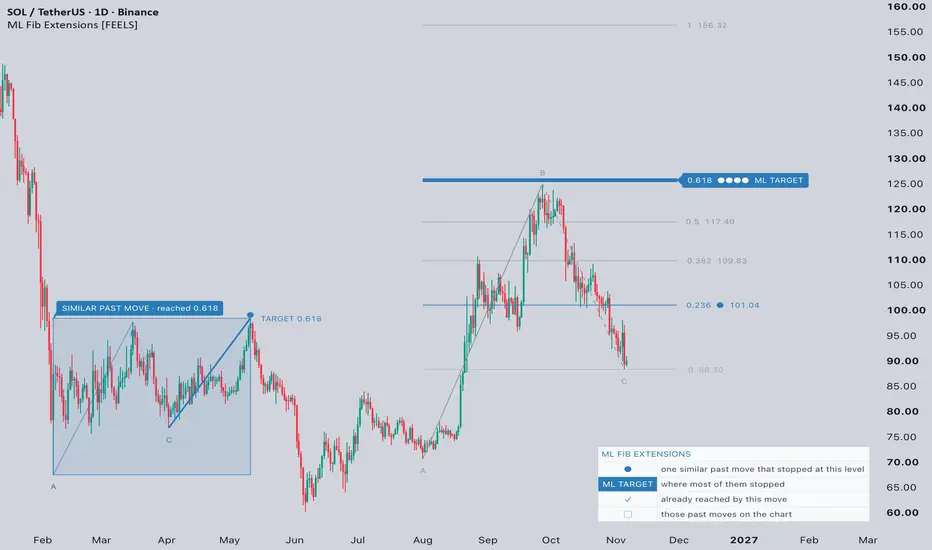
SOL/USDT, 1D. The rising leg from the August low, with the pullback still forming. Four of the nine similar moves stopped at 0.618, and so did the one on screen from February. One stopped at 0.236, and the other four went further, above this frame.

FEATURES
- Trend-based Fibonacci extensions on the setup in play, with A, B and C marked and a price next to the levels. The target's price is in its tooltip, or on its label if you switch that on.
- One dot per similar past move, on the highest level it really reached. A thicker line for more dots, grey when none stopped there.
- ML TARGET on the level with the most dots.
- The similar past moves framed on the chart with A, B, C and TARGET, and a caption: SIMILAR PAST MOVE · reached 0.5. Hover the caption for its rank, size, length, depth and exact run.
- A check mark on levels the move from C has already reached.
- Levels on a log scale by default, so after a big drop they stay above zero. Plain price distances are one switch away.
- The grid stops at the highest level with a dot, so far levels don't squeeze the candles.
- A legend card that explains the dots, the target, the check mark and the boxes.
- Three alerts: price reached a level similar moves reached, price reached the ML target, a new swing point was confirmed.
- You can change the numbers, the level list, the target and caption words, the colours and the legend position.
HOW IT WORKS
Swings. A zigzag on closed bars: a swing ends when price moves against it by 4 ATR (ATR 14).
The setup in play. The last three swing points, if the pullback stayed inside the leg. If the pullback is still forming, C is the furthest price has come back so far, and it moves with price until the pullback is confirmed. If the running move has already outgrown the leg before it, the running move becomes the leg.
What it learns from. Every finished setup whose pullback stayed inside the leg and whose next leg went past B. Each is remembered with three features, the leg's size in ATR, its length in bars and the depth of its pullback, and one answer: how far the next leg ran from C, in units of A to B. The last 150 such setups are kept.
The model. k nearest neighbours: the 9 remembered setups closest to the setup in play on those three features, each feature scaled by its spread so none dominates. By default only setups in the same direction are compared.
The levels. Each of the 9 counts once, at the highest extension its next leg reached. Each line is drawn as strong as its count, and the level with the most is the ML target. On a tie it is the level the median move reached.
The levels and the target are redrawn as C moves and as the leg grows, because a different setup has different neighbours. Swings and the learning set are decided on closed bars.
ETH/USDT, 1D. The rising leg from late August, with the pullback still forming. Three similar moves stopped at 1 and three at 0.618. On a tie the target is the level the median move reached, here 1. The two on screen show both: April 2025 reached 1, February 2026 reached 0.618. 0.236 already has its check mark.

HOW TO READ IT
1. The grid is a normal trend-based extension: 0 at C, and each level is measured from C in units of the leg A to B.
2. Each dot next to a number is one similar past move that stopped at that level, before the next one. Grey levels: none of them did.
3. ML TARGET is the level with the most dots. Four dots on one level is a clear answer. Dots spread over many levels mean similar moves did not agree, and that is worth knowing too.
4. The blue boxes are those past moves. On each one, A, B and C mean the same as on the setup in play, and TARGET marks where its run from C stopped. Zoom out to see the older ones. A past move that overlaps the setup in play keeps its dot but gets no box, so the two don't pile up.
5. If the chart doesn't have enough history yet, it says ML is learning and draws the extensions only.
BTC/USDT, 1D. The rising leg from the July low, with the pullback still forming. Four levels have two dots each, so similar moves did not agree here, and the grid shows that. The tie goes to 0.5, the level the median move reached. On screen, one stopped at 0.236 and the other at 0.5.

SETTINGS WORTH KNOWING
- A swing ends after a move against it of, × ATR: 4 by default. Lower gives more and smaller legs to learn from.
- Similar setups it learns from: 9 by default.
- Setups it remembers: 150 by default. Fewer means the similar setups are more recent and more of them are on screen.
- Learn only from setups in the same direction: on by default.
- Levels on log scale: on by default. Off gives plain price distances, the same as a manual extension on a linear scale.
- Extension levels: the list of levels, yours to change.
- Show levels above the highest one reached: off by default.
- A, B, C on the setups, Show the similar setups on the chart and Legend: all on by default.
WHY THIS IS A SEPARATE SCRIPT
My ML Fibonacci asks where a pullback stops, on a retracement grid of one leg. This one asks how far the next leg runs, on extensions measured from C. The setup, the features and the answer are all different, so it is published on its own.
HONESTY
The levels show what similar moves reached once price went past B. They do not say that it will. Many legs never get past B, and those are not counted. A target can even sit short of B on the chart, when the pullback was deep. The levels sit in the direction of the leg A to B because that is how an extension is drawn, not because the model expects that direction.
The model is k nearest neighbours on three features. That is machine learning in the plain sense of the words, not a neural network.
Different data feeds of the same market have different history, so the target can differ between them.
Nothing here is a forecast, and the script does not score itself.
Open source. Read it, change it, and tell me if something is wrong.
Draw a trend-based fib extension and you get a row of targets with nothing to choose between them. This script draws the extensions on the setup in play, a leg A to B and a pullback to C, then finds the past setups on the same chart that were most like it. Each of them puts one dot on the highest extension its next leg really reached. The level with the most dots is marked ML TARGET. The similar past moves are framed on the chart with A, B, C and TARGET, so you can check every one of them yourself.
What makes it different: an ordinary extension treats 1.272 and 2.618 the same. Here every level shows how many of this chart's own similar moves stopped there, and the evidence is on the chart.
SOL/USDT, 1D. The rising leg from the August low, with the pullback still forming. Four of the nine similar moves stopped at 0.618, and so did the one on screen from February. One stopped at 0.236, and the other four went further, above this frame.
FEATURES
- Trend-based Fibonacci extensions on the setup in play, with A, B and C marked and a price next to the levels. The target's price is in its tooltip, or on its label if you switch that on.
- One dot per similar past move, on the highest level it really reached. A thicker line for more dots, grey when none stopped there.
- ML TARGET on the level with the most dots.
- The similar past moves framed on the chart with A, B, C and TARGET, and a caption: SIMILAR PAST MOVE · reached 0.5. Hover the caption for its rank, size, length, depth and exact run.
- A check mark on levels the move from C has already reached.
- Levels on a log scale by default, so after a big drop they stay above zero. Plain price distances are one switch away.
- The grid stops at the highest level with a dot, so far levels don't squeeze the candles.
- A legend card that explains the dots, the target, the check mark and the boxes.
- Three alerts: price reached a level similar moves reached, price reached the ML target, a new swing point was confirmed.
- You can change the numbers, the level list, the target and caption words, the colours and the legend position.
HOW IT WORKS
Swings. A zigzag on closed bars: a swing ends when price moves against it by 4 ATR (ATR 14).
The setup in play. The last three swing points, if the pullback stayed inside the leg. If the pullback is still forming, C is the furthest price has come back so far, and it moves with price until the pullback is confirmed. If the running move has already outgrown the leg before it, the running move becomes the leg.
What it learns from. Every finished setup whose pullback stayed inside the leg and whose next leg went past B. Each is remembered with three features, the leg's size in ATR, its length in bars and the depth of its pullback, and one answer: how far the next leg ran from C, in units of A to B. The last 150 such setups are kept.
The model. k nearest neighbours: the 9 remembered setups closest to the setup in play on those three features, each feature scaled by its spread so none dominates. By default only setups in the same direction are compared.
The levels. Each of the 9 counts once, at the highest extension its next leg reached. Each line is drawn as strong as its count, and the level with the most is the ML target. On a tie it is the level the median move reached.
The levels and the target are redrawn as C moves and as the leg grows, because a different setup has different neighbours. Swings and the learning set are decided on closed bars.
ETH/USDT, 1D. The rising leg from late August, with the pullback still forming. Three similar moves stopped at 1 and three at 0.618. On a tie the target is the level the median move reached, here 1. The two on screen show both: April 2025 reached 1, February 2026 reached 0.618. 0.236 already has its check mark.
HOW TO READ IT
1. The grid is a normal trend-based extension: 0 at C, and each level is measured from C in units of the leg A to B.
2. Each dot next to a number is one similar past move that stopped at that level, before the next one. Grey levels: none of them did.
3. ML TARGET is the level with the most dots. Four dots on one level is a clear answer. Dots spread over many levels mean similar moves did not agree, and that is worth knowing too.
4. The blue boxes are those past moves. On each one, A, B and C mean the same as on the setup in play, and TARGET marks where its run from C stopped. Zoom out to see the older ones. A past move that overlaps the setup in play keeps its dot but gets no box, so the two don't pile up.
5. If the chart doesn't have enough history yet, it says ML is learning and draws the extensions only.
BTC/USDT, 1D. The rising leg from the July low, with the pullback still forming. Four levels have two dots each, so similar moves did not agree here, and the grid shows that. The tie goes to 0.5, the level the median move reached. On screen, one stopped at 0.236 and the other at 0.5.
SETTINGS WORTH KNOWING
- A swing ends after a move against it of, × ATR: 4 by default. Lower gives more and smaller legs to learn from.
- Similar setups it learns from: 9 by default.
- Setups it remembers: 150 by default. Fewer means the similar setups are more recent and more of them are on screen.
- Learn only from setups in the same direction: on by default.
- Levels on log scale: on by default. Off gives plain price distances, the same as a manual extension on a linear scale.
- Extension levels: the list of levels, yours to change.
- Show levels above the highest one reached: off by default.
- A, B, C on the setups, Show the similar setups on the chart and Legend: all on by default.
WHY THIS IS A SEPARATE SCRIPT
My ML Fibonacci asks where a pullback stops, on a retracement grid of one leg. This one asks how far the next leg runs, on extensions measured from C. The setup, the features and the answer are all different, so it is published on its own.
HONESTY
The levels show what similar moves reached once price went past B. They do not say that it will. Many legs never get past B, and those are not counted. A target can even sit short of B on the chart, when the pullback was deep. The levels sit in the direction of the leg A to B because that is how an extension is drawn, not because the model expects that direction.
The model is k nearest neighbours on three features. That is machine learning in the plain sense of the words, not a neural network.
Different data feeds of the same market have different history, so the target can differ between them.
Nothing here is a forecast, and the script does not score itself.
Open source. Read it, change it, and tell me if something is wrong.

💰Free Channel — t.me/FeelsStrategy
🤵For more info contact — t.me/VolodymyrFeels
🔗 Links — feelsstrategy.com/links
🤵For more info contact — t.me/VolodymyrFeels
🔗 Links — feelsstrategy.com/links
คำจำกัดสิทธิ์ความรับผิดชอบ
ข้อมูลและบทความไม่ได้มีวัตถุประสงค์เพื่อก่อให้เกิดกิจกรรมทางการเงิน, การลงทุน, การซื้อขาย, ข้อเสนอแนะ หรือคำแนะนำประเภทอื่น ๆ ที่ให้หรือรับรองโดย TradingView อ่านเพิ่มเติมใน ข้อกำหนดการใช้งาน
💰Free Channel — t.me/FeelsStrategy
🤵For more info contact — t.me/VolodymyrFeels
🔗 Links — feelsstrategy.com/links
🤵For more info contact — t.me/VolodymyrFeels
🔗 Links — feelsstrategy.com/links
คำจำกัดสิทธิ์ความรับผิดชอบ
ข้อมูลและบทความไม่ได้มีวัตถุประสงค์เพื่อก่อให้เกิดกิจกรรมทางการเงิน, การลงทุน, การซื้อขาย, ข้อเสนอแนะ หรือคำแนะนำประเภทอื่น ๆ ที่ให้หรือรับรองโดย TradingView อ่านเพิ่มเติมใน ข้อกำหนดการใช้งาน