OPEN-SOURCE SCRIPT
ที่อัปเดต: MACD + Volume
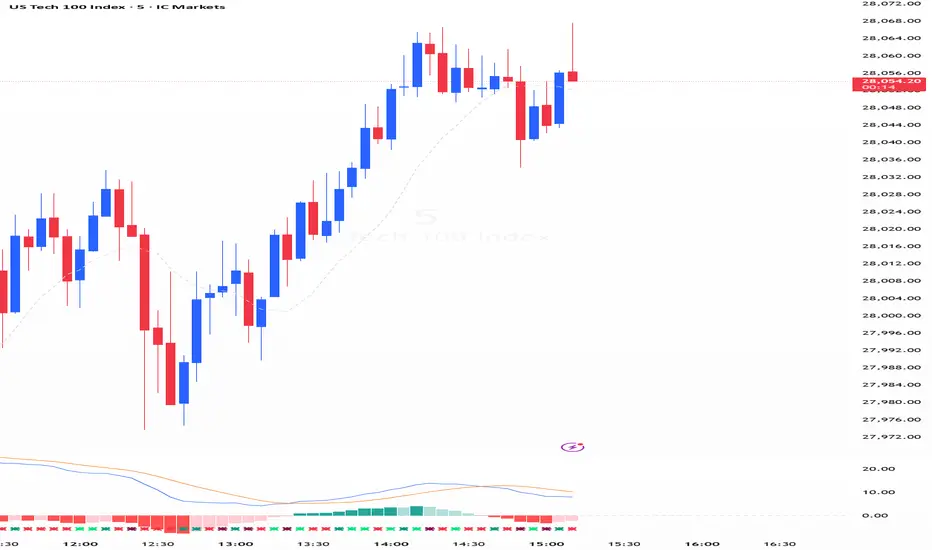
MACD + Volume Indicator
This composite tool integrates three distinct technical indicators commonly used in intraday and swing trading analysis:
Moving Average Convergence Divergence (MACD):
A momentum oscillator derived from moving averages. It measures both trend direction and momentum by comparing short-term and long-term moving averages. The indicator allows customization of oscillator and signal line types, supporting SMA and EMA (default), as well as RMA, WMA, and VWMA.
Cumulative Volume Delta (CVD):
A volume-based indicator that tracks the cumulative difference between buying and selling pressure. By default, it uses diamond markers to represent whether the cumulative delta is trending upward or downward. This component can be disabled at any time if the user prefers.
Up/Down Volume:
Another volume-based measure that highlights bullish versus bearish volume shifts. By default, it employs triangle markers to indicate whether the volume delta is positive (bullish) or negative (bearish). This component can also be disabled at any time according to user preference.
This composite tool integrates three distinct technical indicators commonly used in intraday and swing trading analysis:
Moving Average Convergence Divergence (MACD):
A momentum oscillator derived from moving averages. It measures both trend direction and momentum by comparing short-term and long-term moving averages. The indicator allows customization of oscillator and signal line types, supporting SMA and EMA (default), as well as RMA, WMA, and VWMA.
Cumulative Volume Delta (CVD):
A volume-based indicator that tracks the cumulative difference between buying and selling pressure. By default, it uses diamond markers to represent whether the cumulative delta is trending upward or downward. This component can be disabled at any time if the user prefers.
Up/Down Volume:
Another volume-based measure that highlights bullish versus bearish volume shifts. By default, it employs triangle markers to indicate whether the volume delta is positive (bullish) or negative (bearish). This component can also be disabled at any time according to user preference.
Release Note
Update 2026/04/29:Add two configuration variables:
Volume Analysis Length: Default value, 12 periods (modifiable by the user). This variable corresponds to the number of periods over which the average is calculated.
Volume Ratio: Default value, 1.5 (modifiable by the user). This variable corresponds to the threshold value from which a volume alert is generated.
When the current period’s volume exceeds the average of the previous periods defined in Volume Analysis Length by the specified Volume Ratio, the color of the cumulative delta volume and up/down volume indicators changes accordingly.
Release Note
Update 2 2026/04/29:New option: "Change histogram color on high volume"
The MACD histogram changes its color if the volume from the CVD and Up/Down indicators exceeds the average, according to the parameters "Volume Analysis Length" and "Volume Ratio". This option is disabled by default, and when enabled, it operates even if the "Show Delta Volume" and "Show CVD" indicators are turned off.
Fixed:
delta and last volume values, are plotted as Values in status line
CVD indicator on top location by default
Release Note
1. CVD Indicator (Top position): Changes color if the body size of the bar (excluding the wick) is greater than the average of previous periods.
2. Up/Down Volume Indicator:
Changes color if the absolute delta value (difference between the last volume and the opening volume) is greater than the average of previous periods.
3. MACD Histogram:
Changes color if the conditions of the CVD and Up/Down indicators are met, and additionally, the total volume of the period is greater than the average of previous periods.
The default colors to display these volume changes are lime and maroon.
All three indicators operate based on the values of "Volume Analysis Length" and "Volume Ratio".
Release Note
Fixed:Tooltip related to the MACD histogram color calculation.
Status line values related to the CVD and Up/Down Volume indicators are now expressed in volume format (e.g., 3.13K).
Updated:
Up/Down Volume Indicator code optimized: Similar to CVD, it now displays diamonds by default, and the color indicates whether the trend is bullish or bearish.
Release Note
If the conditions of the CVD and Up/Down indicators are met, and additionally, the total volume of the period is greater than the average of previous periods, Now, you can choose to change color of Macd line, signal line or histogram as you preferYou can overlay on the main chart (above the candlestick chart, outside of the indicator) a Moving Average (MA) of the type and number of periods of your preference.
สคริปต์แบบโอเพนซอร์ส
ด้วยเจตนารมณ์หลักของ TradingView ผู้สร้างสคริปต์นี้ได้ทำให้เป็นโอเพนซอร์ส เพื่อให้เทรดเดอร์สามารถตรวจสอบและยืนยันฟังก์ชันการทำงานของมันได้ ขอชื่นชมผู้เขียน! แม้ว่าคุณจะใช้งานได้ฟรี แต่โปรดจำไว้ว่าการเผยแพร่โค้ดซ้ำจะต้องเป็นไปตาม กฎระเบียบการใช้งาน ของเรา

คำจำกัดสิทธิ์ความรับผิดชอบ
ข้อมูลและบทความไม่ได้มีวัตถุประสงค์เพื่อก่อให้เกิดกิจกรรมทางการเงิน, การลงทุน, การซื้อขาย, ข้อเสนอแนะ หรือคำแนะนำประเภทอื่น ๆ ที่ให้หรือรับรองโดย TradingView อ่านเพิ่มเติมใน ข้อกำหนดการใช้งาน
สคริปต์แบบโอเพนซอร์ส
ด้วยเจตนารมณ์หลักของ TradingView ผู้สร้างสคริปต์นี้ได้ทำให้เป็นโอเพนซอร์ส เพื่อให้เทรดเดอร์สามารถตรวจสอบและยืนยันฟังก์ชันการทำงานของมันได้ ขอชื่นชมผู้เขียน! แม้ว่าคุณจะใช้งานได้ฟรี แต่โปรดจำไว้ว่าการเผยแพร่โค้ดซ้ำจะต้องเป็นไปตาม กฎระเบียบการใช้งาน ของเรา
คำจำกัดสิทธิ์ความรับผิดชอบ
ข้อมูลและบทความไม่ได้มีวัตถุประสงค์เพื่อก่อให้เกิดกิจกรรมทางการเงิน, การลงทุน, การซื้อขาย, ข้อเสนอแนะ หรือคำแนะนำประเภทอื่น ๆ ที่ให้หรือรับรองโดย TradingView อ่านเพิ่มเติมใน ข้อกำหนดการใช้งาน