OPEN-SOURCE SCRIPT
Crowded Trend Exhaustion Index [TradeDots]
Crowded Trend Exhaustion Index [TradeDots]
Summary
This indicator measures how statistically crowded the current trade has become and reports the reading on a 0 to 100 scale with four named tiers: Healthy, Late, Crowded, and Climax Risk. It is not a top or bottom caller. The goal is to give traders an explicit picture of how stretched price has become relative to historical context, so they can avoid late entries, tighten stops, or take profit when the reading enters extreme territory.
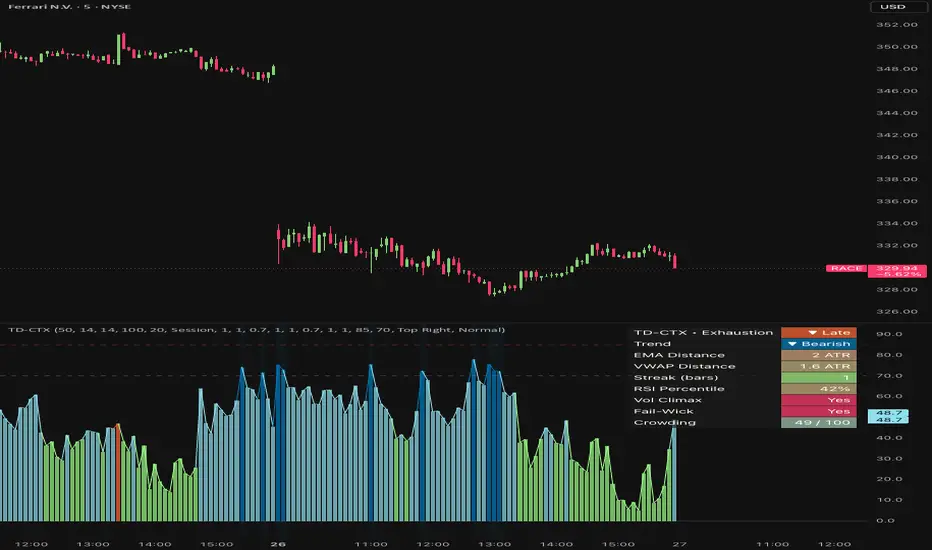
Eight independent factors are combined into the composite score. The pane shows a histogram of the score plus reference lines at the tier thresholds; the background of the pane is tinted when the reading enters the Crowded or Climax Risk tier; a dashboard summarizes the contributing factors.
What is original here
Many public indicators measure one dimension of exhaustion (most commonly distance from a moving average, or RSI level). The contribution of this script is the combination of eight diverse factors that together describe trade crowding from different angles: spatial extension (EMA distance, VWAP distance), persistence (consecutive same-direction candles), momentum exhaustion (RSI percentile), participation extreme (volume climax), volatility expansion (ATR percentile), behavioural rejection (failed continuation wicks with hysteresis), and price/momentum divergence. Each factor weight is exposed as an input so users can audit and tune the composite. The script also deliberately treats divergence and failed-wick signals with a multi-bar hysteresis so single-bar prints do not produce one-bar spikes in the score.
How it works
The trend direction used by the script is the immediate-bar EMA slope. The trend EMA length is configurable (default 50).
The eight factors are computed each bar.
1. EMA distance. Absolute distance from the trend EMA in ATR units, scaled to 0-100.
2. VWAP distance. Absolute distance from an anchored VWAP (Session, Week, or Month — user-selectable) in ATR units, scaled.
3. Candle streak. Number of consecutive same-direction candles aligned with the trend. The counter resets to zero on the first counter-direction bar and the score scales with the streak length.
4. RSI percentile. RSI is computed and percentile-ranked over the configurable lookback. The percentile is taken on the trend side (uptrend uses RSI percentile directly; downtrend uses 100 minus the percentile) so that extreme readings always indicate crowding in the direction of the trend.
5. Volume climax. A discrete score: 100 when volume is in the top decile, 60 in the top quartile, 30 above the median, 0 otherwise.
6. ATR percentile. Current ATR percentile over the lookback.
7. Failed continuation wick. When the current bar prints a wick against the trend direction that exceeds the body by a factor of two, a five-bar hysteresis counter is set. The score decays linearly to zero over five bars. This prevents one-bar wick noise from spiking the score and then disappearing.
8. Price-momentum divergence. Price prints a new N-bar extreme but RSI does not. Bearish divergence in an uptrend, or bullish divergence in a downtrend, sets a five-bar hysteresis just like factor 7.
All factors are weighted (user-configurable), averaged, and clamped to 0-100. Tier mapping:
Repainting and data integrity
All factors are computed on confirmed-bar values; alerts are gated by barstate.isconfirmed. No request.security() calls are made — the script operates entirely on the chart timeframe. The hysteresis counters for divergence and failed-wick reset deterministically and do not look forward.
How to read the chart
Inputs
Inputs are grouped into four sections.
Alerts
Four alert conditions are provided:
Each is declared via alertcondition() and is fired programmatically through alert() when the corresponding input toggle is enabled, using alert.freq_once_per_bar_close. Alert messages include {{ticker}} and {{interval}} placeholders.
How to use this script
This is a profit-taking and late-entry-avoidance tool, not an entry trigger.
Limitations and honest caveats
Disclaimer
This script is published for informational and educational purposes. It is not investment advice and is not a recommendation to buy or sell any instrument. A high crowding reading is not a signal to reverse; it is a description of statistical extension. Users are solely responsible for their own trading decisions and risk management.
Summary
This indicator measures how statistically crowded the current trade has become and reports the reading on a 0 to 100 scale with four named tiers: Healthy, Late, Crowded, and Climax Risk. It is not a top or bottom caller. The goal is to give traders an explicit picture of how stretched price has become relative to historical context, so they can avoid late entries, tighten stops, or take profit when the reading enters extreme territory.
Eight independent factors are combined into the composite score. The pane shows a histogram of the score plus reference lines at the tier thresholds; the background of the pane is tinted when the reading enters the Crowded or Climax Risk tier; a dashboard summarizes the contributing factors.
What is original here
Many public indicators measure one dimension of exhaustion (most commonly distance from a moving average, or RSI level). The contribution of this script is the combination of eight diverse factors that together describe trade crowding from different angles: spatial extension (EMA distance, VWAP distance), persistence (consecutive same-direction candles), momentum exhaustion (RSI percentile), participation extreme (volume climax), volatility expansion (ATR percentile), behavioural rejection (failed continuation wicks with hysteresis), and price/momentum divergence. Each factor weight is exposed as an input so users can audit and tune the composite. The script also deliberately treats divergence and failed-wick signals with a multi-bar hysteresis so single-bar prints do not produce one-bar spikes in the score.
How it works
The trend direction used by the script is the immediate-bar EMA slope. The trend EMA length is configurable (default 50).
The eight factors are computed each bar.
1. EMA distance. Absolute distance from the trend EMA in ATR units, scaled to 0-100.
2. VWAP distance. Absolute distance from an anchored VWAP (Session, Week, or Month — user-selectable) in ATR units, scaled.
3. Candle streak. Number of consecutive same-direction candles aligned with the trend. The counter resets to zero on the first counter-direction bar and the score scales with the streak length.
4. RSI percentile. RSI is computed and percentile-ranked over the configurable lookback. The percentile is taken on the trend side (uptrend uses RSI percentile directly; downtrend uses 100 minus the percentile) so that extreme readings always indicate crowding in the direction of the trend.
5. Volume climax. A discrete score: 100 when volume is in the top decile, 60 in the top quartile, 30 above the median, 0 otherwise.
6. ATR percentile. Current ATR percentile over the lookback.
7. Failed continuation wick. When the current bar prints a wick against the trend direction that exceeds the body by a factor of two, a five-bar hysteresis counter is set. The score decays linearly to zero over five bars. This prevents one-bar wick noise from spiking the score and then disappearing.
8. Price-momentum divergence. Price prints a new N-bar extreme but RSI does not. Bearish divergence in an uptrend, or bullish divergence in a downtrend, sets a five-bar hysteresis just like factor 7.
All factors are weighted (user-configurable), averaged, and clamped to 0-100. Tier mapping:
- Healthy : 0 to 40
- Late : 40 to crowded_threshold (default 70)
- Crowded : crowded_threshold to extreme_threshold (default 85)
- Climax Risk : extreme_threshold to 100
Repainting and data integrity
All factors are computed on confirmed-bar values; alerts are gated by barstate.isconfirmed. No request.security() calls are made — the script operates entirely on the chart timeframe. The hysteresis counters for divergence and failed-wick reset deterministically and do not look forward.
How to read the chart
- The composite is plotted as a colored histogram in the indicator pane. The color reflects the current tier (green for Healthy, orange for Late, pink for Crowded, red for Climax Risk).
- Reference lines mark the tier thresholds.
- The pane background is tinted when the reading enters the Crowded or Climax Risk tier.
- The dashboard panel shows the current tier, each contributing factor's reading, and the composite score.
Inputs
Inputs are grouped into four sections.
- Core Settings: trend EMA length, ATR length, RSI length, percentile lookback, divergence lookback, VWAP anchor.
- Score Tuning: a 0 to N weight for each of the eight factors, the Climax Risk threshold, the Crowded threshold.
- Visual Settings: histogram toggle, dashboard toggle, background-tint toggle, panel position and size, panel background color.
- Any Alert() function call conditions: per-alert toggles.
Alerts
Four alert conditions are provided:
- Entered Crowded Zone (score crossed the Crowded threshold from below)
- Entered Climax Risk Zone (score crossed the Climax Risk threshold from below)
- Divergence Detected (a price-momentum divergence triggered this bar)
- Exhaustion Cooling (score fell back below the Crowded threshold from above)
Each is declared via alertcondition() and is fired programmatically through alert() when the corresponding input toggle is enabled, using alert.freq_once_per_bar_close. Alert messages include {{ticker}} and {{interval}} placeholders.
How to use this script
This is a profit-taking and late-entry-avoidance tool, not an entry trigger.
- Apply on the timeframe where you make trading decisions.
- While the score is Healthy or Late, the trend can continue to extend; this is not a fade signal.
- When the score enters Crowded or Climax Risk on the trend side, tighten stops on existing trend trades, scale out, or avoid late entries.
- The Divergence alert is a secondary signal — it indicates internal momentum disagreement but is not a reversal call on its own.
- The Exhaustion Cooling alert can be used to identify the end of a stretched move, which sometimes precedes a fresh trend or a multi-bar consolidation.
Limitations and honest caveats
- "Crowded" does not mean "imminent reversal". Strong trends can stay crowded for extended periods.
- The composite is a heuristic, not a probability.
- The divergence factor requires that price prints a new N-bar extreme. Divergences that occur without a fresh extreme will not be detected.
- The VWAP factor uses a single anchor at a time (Session, Week, or Month). Multiple simultaneous VWAP comparisons are not supported.
- The streak counter resets on a single counter-direction candle, which can cause sharp drops in the streak factor that do not necessarily indicate the trend is over.
- The script makes no prediction about when or how a stretched trend will end.
Disclaimer
This script is published for informational and educational purposes. It is not investment advice and is not a recommendation to buy or sell any instrument. A high crowding reading is not a signal to reverse; it is a description of statistical extension. Users are solely responsible for their own trading decisions and risk management.
สคริปต์โอเพนซอร์ซ
ด้วยเจตนารมณ์หลักของ TradingView ผู้สร้างสคริปต์นี้ได้ทำให้เป็นโอเพนซอร์ส เพื่อให้เทรดเดอร์สามารถตรวจสอบและยืนยันฟังก์ชันการทำงานของมันได้ ขอชื่นชมผู้เขียน! แม้ว่าคุณจะใช้งานได้ฟรี แต่โปรดจำไว้ว่าการเผยแพร่โค้ดซ้ำจะต้องเป็นไปตาม กฎระเบียบการใช้งาน ของเรา

TradeDots — the cockpit for active traders.
AI screeners & indicators.
Subscribe now: tradedots.ai/
Not financial advice.
AI screeners & indicators.
Subscribe now: tradedots.ai/
Not financial advice.
คำจำกัดสิทธิ์ความรับผิดชอบ
ข้อมูลและบทความไม่ได้มีวัตถุประสงค์เพื่อก่อให้เกิดกิจกรรมทางการเงิน, การลงทุน, การซื้อขาย, ข้อเสนอแนะ หรือคำแนะนำประเภทอื่น ๆ ที่ให้หรือรับรองโดย TradingView อ่านเพิ่มเติมใน ข้อกำหนดการใช้งาน
สคริปต์โอเพนซอร์ซ
ด้วยเจตนารมณ์หลักของ TradingView ผู้สร้างสคริปต์นี้ได้ทำให้เป็นโอเพนซอร์ส เพื่อให้เทรดเดอร์สามารถตรวจสอบและยืนยันฟังก์ชันการทำงานของมันได้ ขอชื่นชมผู้เขียน! แม้ว่าคุณจะใช้งานได้ฟรี แต่โปรดจำไว้ว่าการเผยแพร่โค้ดซ้ำจะต้องเป็นไปตาม กฎระเบียบการใช้งาน ของเรา
TradeDots — the cockpit for active traders.
AI screeners & indicators.
Subscribe now: tradedots.ai/
Not financial advice.
AI screeners & indicators.
Subscribe now: tradedots.ai/
Not financial advice.
คำจำกัดสิทธิ์ความรับผิดชอบ
ข้อมูลและบทความไม่ได้มีวัตถุประสงค์เพื่อก่อให้เกิดกิจกรรมทางการเงิน, การลงทุน, การซื้อขาย, ข้อเสนอแนะ หรือคำแนะนำประเภทอื่น ๆ ที่ให้หรือรับรองโดย TradingView อ่านเพิ่มเติมใน ข้อกำหนดการใช้งาน