OPEN-SOURCE SCRIPT
Strong H4 Gold Reach Matrix | ProjectSyndicate
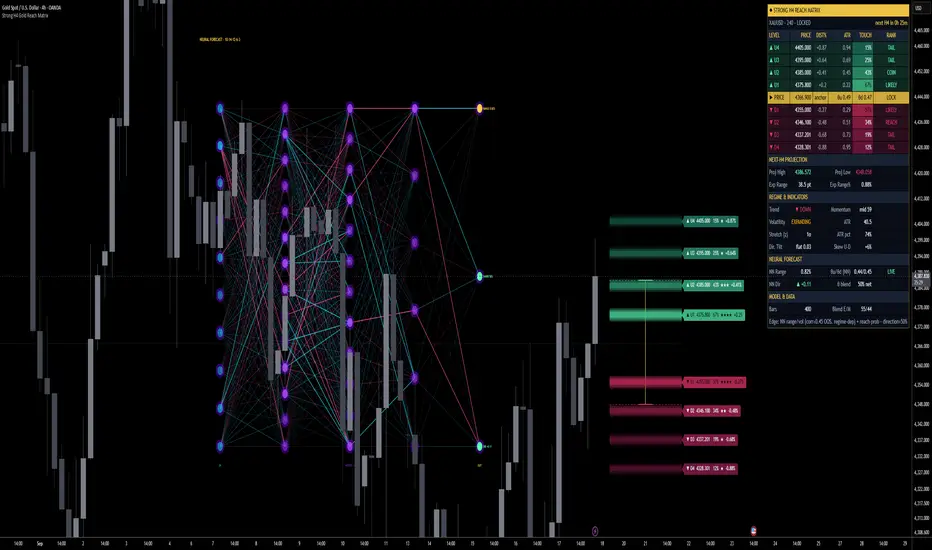
Strong H4 Reach Matrix Gold answers the one question a discretionary gold trader asks before every H4 bar: where is the next candle likely to trade, and with what odds? It is not a restyled oscillator with an arrow bolted on. It projects the next H4 candle as eight distinct price levels — four above, four below — each carrying a calibrated touch probability, placed by a live volatility-scaled excursion model, cross-checked against the raw empirical behaviour of your own chart, and sharpened by a genuine neural network whose weights were trained offline on XAUUSD H4 and whose forward pass runs live on every bar. The whole network is drawn on the chart as an inspectable diagram, and the projection freezes at each close so it never repaints. You are shown the odds, the model that produced them, and the assumptions behind them — not a single line that quietly redraws as the bar plays out.
⚠️ Gold H4 Only!!! networks was trained on gold H4 data.
🎯 Reach Engine — the core idea. For each new H4 bar the script asks how far price is likely to stretch from the last close, up and down, and converts that into probabilities. The excursion of a bar beyond the prior close, measured in ATR, follows an approximately exponential survival law: the chance of reaching a distance of k·ATR is close to e^(−k/θ), where θ is the typical (mean) ATR-excursion estimated live from a rolling window. Invert it — k = −θ·ln(p) — and any target probability p maps to a precise distance. Four upside and four downside probability targets therefore become eight price levels, each an honest "odds of touching this in the next bar" rather than a round-number guess.
📊 Empirical Survival Cross-Check. A pure model can be elegant and still wrong for the instrument in front of you, so the engine never trusts the formula alone. On every bar it walks the last N completed bars and directly counts how often price actually reached each of the eight thresholds — the raw empirical survival curve of your chart — and blends that with the smooth exponential tail (55/45 by default, fully adjustable from pure-empirical to pure-model). The displayed percentage is this blended, calibrated figure, not the target you dialled in.
🧠 Neural Core. Sitting on top of the statistical engine is a real multi-layer perceptron — 10 inputs, three hidden layers of 14, 12 and 6 tanh neurons, and three linear outputs, for 398 trained weights and 35 biases. It was trained offline by backpropagation on XAUUSD H4 history; the learned matrices are embedded directly in the script, and the on-chart forward pass — weighted sums, biases and tanh activations, layer by layer — reproduces the trained model exactly. Nothing is trained on your chart, so the mapping is fixed and deterministic. Its lifecycle each bar is FEATURE ▸ STANDARDISE ▸ FORWARD ▸ APPLY: the network predicts the next bar's range, its up/down split and its direction, and those outputs feed straight back into the projection — the range forecast sharpens θ (and therefore the spacing of all eight levels and the expected-range box), the split skews the up-vs-down odds, and the direction feeds the secondary tilt.
🔢 Feature Anatomy. The fingerprint is ten causal, percentage-based ingredients read only from completed bars: 5-bar momentum, stochastic range position (14), RSI(14), 5-bar average range %, 5-bar average body %, a short-vs-medium momentum acceleration, ATR %, the ATR(14)/ATR(50) volatility-regime ratio, distance from the EMA(20) expressed in ATR units, and a volume ratio. Working in ratio and percentage space rather than raw price is what lets a single learned mapping run on a market that travelled from the 2,000s into the 4,000s without the price level itself swamping the signal.
📐 Fixed Standardisation — deliberately, not by accident. Each feature is standardised against baked-in training statistics rather than a rolling window. This is a considered choice: the forecastable part of next-bar behaviour lives in the level of volatility, and rolling z-scoring silently erases exactly that level. Standardising against the training distribution preserves it, so the network can actually respond to whether the market is calm or violent right now.
🧊 Frozen at the Close — non-repaint by default. Every input is read from candles that have already closed, and the projection is anchored to the last completed H4 close. The eight levels, their probabilities, the expected-range box and the network's outputs are computed once when the bar opens and stay fixed until it closes — no sliding lines, no intrabar drift, no numbers that quietly improve as the session plays out. A "Live price (intrabar)" anchor is available for those who explicitly want a conditional, moving read.
🧭 No-Lookahead. Every network feature is lagged to the last closed bar and every excursion statistic is causal, so the value printed on any historical bar is identical whether or not the bars after it exist. On-chart machine learning most often fails here; this is built to avoid it.
🧱 Structural Snap + Minimum Spacing. Levels can optionally seat themselves on nearby swing-pivot liquidity or round numbers when one lies within tolerance, so they sit where price actually reacts rather than at arbitrary decimals — and probabilities recompute from the snapped distance. A hard minimum-spacing floor then guarantees the eight levels never glue together near the anchor or after snapping; each is separated from its neighbour by a set fraction of ATR, so every level is distinct and every probability is meaningful.
🧭 Directional Tilt — secondary by design. A small continuation tilt from trend (EMA20/50), momentum (RSI), short-horizon velocity and the network's own direction output shifts the up-vs-down odds. It is deliberately mild and clearly labelled: next-bar direction on gold is close to a coin flip, and the tool treats it that way rather than dressing it up as a signal.
🕸️ Live Network Map. The model is not a black box. The full network is drawn on the chart — an input column tagged with each feature, three hidden columns and an output column carrying RANGE, UP-SHARE and DIRECTION — with every node shaded by its live activation and every connection coloured by weight sign and brightened by the signal actually passing through it. Placement is deterministic (a bars-back offset that drops it cleanly into view, or out past the projection), so it renders exactly where you put it and never wanders off-screen.
📋 Dashboard. A compact panel reports, in real time: symbol/timeframe and lock state, the anchor close, the full 4×4 ladder (price, distance %, distance in ATR, calibrated touch %, and a PRIME/LIKELY/COIN/REACH/TAIL rank per level), the projected High/Low/expected range, a regime read (trend, momentum, volatility state, ATR percentile, stretch, tilt), and a dedicated Neural Forecast block showing the network's range output, its θ contribution, its direction call and the blend weight — with a standing one-line note on where the edge actually is.
🎚️ Controls. The history window and volatility length, the four probability bands, the minimum spacing, the empirical/model blend, the tilt weights, the snap behaviour, the network blend weights, and every visual element — beams, labels, projected candle, the network map's placement, size, connector style and theme, and the dashboard — are all adjustable. None of them change the trained model; they change how you read it.
🎯 Why this is different. Most "AI" indicators restyle an oscillator; most that claim a neural network never show one. This runs an actual trained MLP, draws it live, standardises its inputs so there is no lookahead, freezes each projection at the close so it cannot repaint, cross-checks its probabilities against your own chart's realised behaviour, and states plainly where its edge is and is not.
🚀 Where to use it. The model and calibration were built specifically for XAUUSD on the H4 timeframe, and that is where it is designed to run; the dashboard flags any mismatch. The first bars of a chart are a warm-up while the causal windows fill, after which the projection and dashboard come alive.
🎯 How to trade it
Apply it to XAUUSD H4 and let the windows warm up until the dashboard reads a live projection.
At each new H4 candle, read the eight levels and their calibrated touch probabilities — locked at the open, they will not move. Treat the PRIME/LIKELY levels as high-odds reach zones and the COIN/REACH/TAIL levels as progressively lower-odds stretches.
Use the expected-range box and projected High/Low as context for where the bar may reach — a reference for targets, fades and stop placement — not as an automatic entry.
Glance at the network map and the Neural Forecast block to see whether the model reads the coming bar as expansion or contraction, and whether volatility is being sharpened up or down.
Combine it with your own structure, levels and risk. It describes a likely next-bar envelope with odds; it is not an entry-and-exit system on its own.
⚠️ Important. This is a decision-support tool, not a standalone buy/sell system, and it makes no performance guarantees. Its honest edges are reach probability and volatility, not direction. In leakage-free testing the calibrated bands held up out-of-sample — target reach rates of roughly 85 / 65 / 45 / 25 % realised at about 83–87 / 64–70 / 44–49 / 23–25 % — and next-bar range correlates with current volatility at around 0.57. That range signal is real but regime-dependent: it is strong in trending/clustered-volatility periods and can fall close to zero in quiet stretches (in recent-quarter testing it did exactly that), and the network's out-of-sample range correlation of roughly 0.44 reflects the same regime dependence. Next-bar direction is treated as a coin flip because that is what it is — the up/down split stays near-symmetric and the tilt is a small adjustment, never a signal. The model is fixed and pre-trained, so bars inside its training period are in-sample by nature; genuine out-of-sample behaviour is what you see going forward. It is deliberately a modest network — larger nets overfit this much H4 data and test worse. Always let the candle open so the projection is frozen, and test it on your own data before trading it live.
⚠️ Gold H4 Only!!! networks was trained on gold H4 data.
🎯 Reach Engine — the core idea. For each new H4 bar the script asks how far price is likely to stretch from the last close, up and down, and converts that into probabilities. The excursion of a bar beyond the prior close, measured in ATR, follows an approximately exponential survival law: the chance of reaching a distance of k·ATR is close to e^(−k/θ), where θ is the typical (mean) ATR-excursion estimated live from a rolling window. Invert it — k = −θ·ln(p) — and any target probability p maps to a precise distance. Four upside and four downside probability targets therefore become eight price levels, each an honest "odds of touching this in the next bar" rather than a round-number guess.
📊 Empirical Survival Cross-Check. A pure model can be elegant and still wrong for the instrument in front of you, so the engine never trusts the formula alone. On every bar it walks the last N completed bars and directly counts how often price actually reached each of the eight thresholds — the raw empirical survival curve of your chart — and blends that with the smooth exponential tail (55/45 by default, fully adjustable from pure-empirical to pure-model). The displayed percentage is this blended, calibrated figure, not the target you dialled in.
🧠 Neural Core. Sitting on top of the statistical engine is a real multi-layer perceptron — 10 inputs, three hidden layers of 14, 12 and 6 tanh neurons, and three linear outputs, for 398 trained weights and 35 biases. It was trained offline by backpropagation on XAUUSD H4 history; the learned matrices are embedded directly in the script, and the on-chart forward pass — weighted sums, biases and tanh activations, layer by layer — reproduces the trained model exactly. Nothing is trained on your chart, so the mapping is fixed and deterministic. Its lifecycle each bar is FEATURE ▸ STANDARDISE ▸ FORWARD ▸ APPLY: the network predicts the next bar's range, its up/down split and its direction, and those outputs feed straight back into the projection — the range forecast sharpens θ (and therefore the spacing of all eight levels and the expected-range box), the split skews the up-vs-down odds, and the direction feeds the secondary tilt.
🔢 Feature Anatomy. The fingerprint is ten causal, percentage-based ingredients read only from completed bars: 5-bar momentum, stochastic range position (14), RSI(14), 5-bar average range %, 5-bar average body %, a short-vs-medium momentum acceleration, ATR %, the ATR(14)/ATR(50) volatility-regime ratio, distance from the EMA(20) expressed in ATR units, and a volume ratio. Working in ratio and percentage space rather than raw price is what lets a single learned mapping run on a market that travelled from the 2,000s into the 4,000s without the price level itself swamping the signal.
📐 Fixed Standardisation — deliberately, not by accident. Each feature is standardised against baked-in training statistics rather than a rolling window. This is a considered choice: the forecastable part of next-bar behaviour lives in the level of volatility, and rolling z-scoring silently erases exactly that level. Standardising against the training distribution preserves it, so the network can actually respond to whether the market is calm or violent right now.
🧊 Frozen at the Close — non-repaint by default. Every input is read from candles that have already closed, and the projection is anchored to the last completed H4 close. The eight levels, their probabilities, the expected-range box and the network's outputs are computed once when the bar opens and stay fixed until it closes — no sliding lines, no intrabar drift, no numbers that quietly improve as the session plays out. A "Live price (intrabar)" anchor is available for those who explicitly want a conditional, moving read.
🧭 No-Lookahead. Every network feature is lagged to the last closed bar and every excursion statistic is causal, so the value printed on any historical bar is identical whether or not the bars after it exist. On-chart machine learning most often fails here; this is built to avoid it.
🧱 Structural Snap + Minimum Spacing. Levels can optionally seat themselves on nearby swing-pivot liquidity or round numbers when one lies within tolerance, so they sit where price actually reacts rather than at arbitrary decimals — and probabilities recompute from the snapped distance. A hard minimum-spacing floor then guarantees the eight levels never glue together near the anchor or after snapping; each is separated from its neighbour by a set fraction of ATR, so every level is distinct and every probability is meaningful.
🧭 Directional Tilt — secondary by design. A small continuation tilt from trend (EMA20/50), momentum (RSI), short-horizon velocity and the network's own direction output shifts the up-vs-down odds. It is deliberately mild and clearly labelled: next-bar direction on gold is close to a coin flip, and the tool treats it that way rather than dressing it up as a signal.
🕸️ Live Network Map. The model is not a black box. The full network is drawn on the chart — an input column tagged with each feature, three hidden columns and an output column carrying RANGE, UP-SHARE and DIRECTION — with every node shaded by its live activation and every connection coloured by weight sign and brightened by the signal actually passing through it. Placement is deterministic (a bars-back offset that drops it cleanly into view, or out past the projection), so it renders exactly where you put it and never wanders off-screen.
📋 Dashboard. A compact panel reports, in real time: symbol/timeframe and lock state, the anchor close, the full 4×4 ladder (price, distance %, distance in ATR, calibrated touch %, and a PRIME/LIKELY/COIN/REACH/TAIL rank per level), the projected High/Low/expected range, a regime read (trend, momentum, volatility state, ATR percentile, stretch, tilt), and a dedicated Neural Forecast block showing the network's range output, its θ contribution, its direction call and the blend weight — with a standing one-line note on where the edge actually is.
🎚️ Controls. The history window and volatility length, the four probability bands, the minimum spacing, the empirical/model blend, the tilt weights, the snap behaviour, the network blend weights, and every visual element — beams, labels, projected candle, the network map's placement, size, connector style and theme, and the dashboard — are all adjustable. None of them change the trained model; they change how you read it.
🎯 Why this is different. Most "AI" indicators restyle an oscillator; most that claim a neural network never show one. This runs an actual trained MLP, draws it live, standardises its inputs so there is no lookahead, freezes each projection at the close so it cannot repaint, cross-checks its probabilities against your own chart's realised behaviour, and states plainly where its edge is and is not.
🚀 Where to use it. The model and calibration were built specifically for XAUUSD on the H4 timeframe, and that is where it is designed to run; the dashboard flags any mismatch. The first bars of a chart are a warm-up while the causal windows fill, after which the projection and dashboard come alive.
🎯 How to trade it
Apply it to XAUUSD H4 and let the windows warm up until the dashboard reads a live projection.
At each new H4 candle, read the eight levels and their calibrated touch probabilities — locked at the open, they will not move. Treat the PRIME/LIKELY levels as high-odds reach zones and the COIN/REACH/TAIL levels as progressively lower-odds stretches.
Use the expected-range box and projected High/Low as context for where the bar may reach — a reference for targets, fades and stop placement — not as an automatic entry.
Glance at the network map and the Neural Forecast block to see whether the model reads the coming bar as expansion or contraction, and whether volatility is being sharpened up or down.
Combine it with your own structure, levels and risk. It describes a likely next-bar envelope with odds; it is not an entry-and-exit system on its own.
⚠️ Important. This is a decision-support tool, not a standalone buy/sell system, and it makes no performance guarantees. Its honest edges are reach probability and volatility, not direction. In leakage-free testing the calibrated bands held up out-of-sample — target reach rates of roughly 85 / 65 / 45 / 25 % realised at about 83–87 / 64–70 / 44–49 / 23–25 % — and next-bar range correlates with current volatility at around 0.57. That range signal is real but regime-dependent: it is strong in trending/clustered-volatility periods and can fall close to zero in quiet stretches (in recent-quarter testing it did exactly that), and the network's out-of-sample range correlation of roughly 0.44 reflects the same regime dependence. Next-bar direction is treated as a coin flip because that is what it is — the up/down split stays near-symmetric and the tilt is a small adjustment, never a signal. The model is fixed and pre-trained, so bars inside its training period are in-sample by nature; genuine out-of-sample behaviour is what you see going forward. It is deliberately a modest network — larger nets overfit this much H4 data and test worse. Always let the candle open so the projection is frozen, and test it on your own data before trading it live.
สคริปต์แบบโอเพนซอร์ส
ด้วยเจตนารมณ์หลักของ TradingView ผู้สร้างสคริปต์นี้ได้ทำให้เป็นโอเพนซอร์ส เพื่อให้เทรดเดอร์สามารถตรวจสอบและยืนยันฟังก์ชันการทำงานของมันได้ ขอชื่นชมผู้เขียน! แม้ว่าคุณจะใช้งานได้ฟรี แต่โปรดจำไว้ว่าการเผยแพร่โค้ดซ้ำจะต้องเป็นไปตาม กฎระเบียบการใช้งาน ของเรา

Institutional-desk · 10+ yrs building trading algos
Syndicate Ultimate · 4 systems · 1 bundle
· 1 payment · lifetime access
Gold · FX · NQ/ES · private systems
syndicate001.com
TG channel
t.me/aisyndicate001
Syndicate Ultimate · 4 systems · 1 bundle
· 1 payment · lifetime access
Gold · FX · NQ/ES · private systems
syndicate001.com
TG channel
t.me/aisyndicate001
คำจำกัดสิทธิ์ความรับผิดชอบ
ข้อมูลและบทความไม่ได้มีวัตถุประสงค์เพื่อก่อให้เกิดกิจกรรมทางการเงิน, การลงทุน, การซื้อขาย, ข้อเสนอแนะ หรือคำแนะนำประเภทอื่น ๆ ที่ให้หรือรับรองโดย TradingView อ่านเพิ่มเติมใน ข้อกำหนดการใช้งาน
สคริปต์แบบโอเพนซอร์ส
ด้วยเจตนารมณ์หลักของ TradingView ผู้สร้างสคริปต์นี้ได้ทำให้เป็นโอเพนซอร์ส เพื่อให้เทรดเดอร์สามารถตรวจสอบและยืนยันฟังก์ชันการทำงานของมันได้ ขอชื่นชมผู้เขียน! แม้ว่าคุณจะใช้งานได้ฟรี แต่โปรดจำไว้ว่าการเผยแพร่โค้ดซ้ำจะต้องเป็นไปตาม กฎระเบียบการใช้งาน ของเรา
Institutional-desk · 10+ yrs building trading algos
Syndicate Ultimate · 4 systems · 1 bundle
· 1 payment · lifetime access
Gold · FX · NQ/ES · private systems
syndicate001.com
TG channel
t.me/aisyndicate001
Syndicate Ultimate · 4 systems · 1 bundle
· 1 payment · lifetime access
Gold · FX · NQ/ES · private systems
syndicate001.com
TG channel
t.me/aisyndicate001
คำจำกัดสิทธิ์ความรับผิดชอบ
ข้อมูลและบทความไม่ได้มีวัตถุประสงค์เพื่อก่อให้เกิดกิจกรรมทางการเงิน, การลงทุน, การซื้อขาย, ข้อเสนอแนะ หรือคำแนะนำประเภทอื่น ๆ ที่ให้หรือรับรองโดย TradingView อ่านเพิ่มเติมใน ข้อกำหนดการใช้งาน