OPEN-SOURCE SCRIPT
+ Ultimate Momentum Oscillator
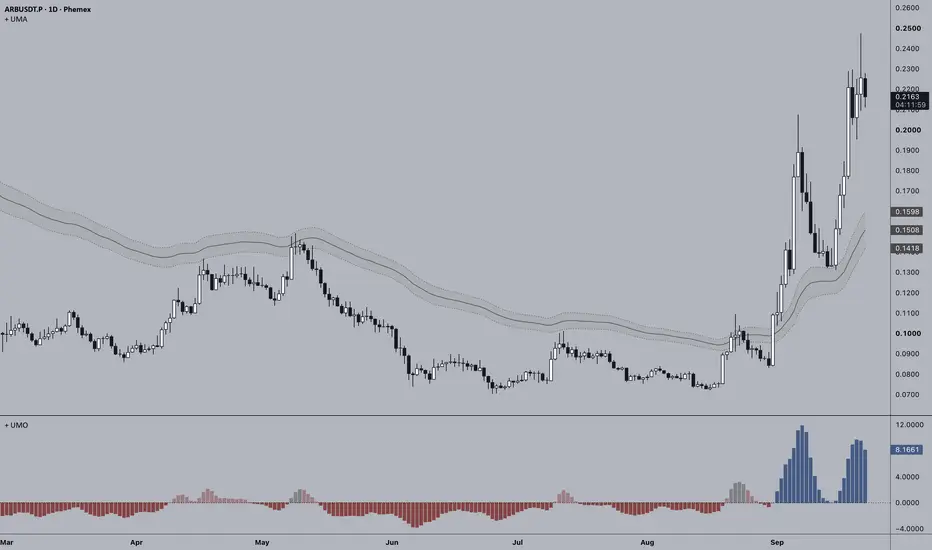
The Ultimate Momentum Oscillator is meant to be a companion piece to my Ultimate Moving Average (the any-moving-average-you-want-it-to-be moving average). It is comprised of two components: 1) the actual plotted indicator which oscillates around a zero line depending on the slope of your defined UMA, and 2) the two color sources based around bias and momentum, or volatility.
A quick description of how my UMA works, and how this indicator incorporates it: The UMA is a user-chosen moving average type applied across five different periods, with the resulting five averages blended together. The default option is an EMA with periods of 8, 21, 55, 144, and 233, but you could pick an SMA, a Hull MA, Zero-lag, Tillson T3, Fractal Adaptive, or several others. Additionally, you can de-blend it by making all the periods the same. If you want a 20 period SMA just make all the periods 20. In addition to this, a channel is created by calculating the UMA separately from the highs and lows. The primary UMA is the average of the resulting high and low UMAs. The UMO simply represents the rate of change—or, in practical terms, the slope—of your UMA as a histogram in a separate pane. When the average is sloping up the histogram is above zero, and vice versa when the average is sloping down. Below are a couple of screens showing both the UMA and UMO set to more commonly used moving averages. Top images is a 21 period EMA, and the bottom image is a 100 period SMA.


Now to describe the second part of the indicator, the color sources, and how they can help you when deciding about where to enter a trade, or if you should enter a trade. There are two color sources, as stated above. One depicts bias and momentum, while the other gives information about volatility. We'll start with Bias + Momentum. I define bias as closing price's relative position to the UMA channel. This is pretty obvious stuff, but above the channel high would be bullish and below the channel low is bearish, while stuck between would be defined as indecisive or a state of transition. Momentum is the rate of change of the moving average. Color is comprised of five different swatches relating to different states: bullish = bullish bias and upward momentum; weak bullish = bullish bias and downward momentum; bearish = bearish bias and downward momentum; weak bearish = bearish bias and upward momentum; and lastly, neutral is price inside the channel. How you use these color clues in combination with the directionality of the histogram and the type of UMA you've created is of course up to you. With the default settings the UMA is best used, along with market structure, as a bias guide, and that bias most of the time trumps shifts in momentum. Being aware of higher timeframe points of interest is important here because these are areas where shifts in momentum can coincide with, or precede, a change in bias—sometimes very quickly and abruptly.
The second color source, volatility, is meant to help the trader, depending on his/her trading style, make a determination about whether a trade should or should not be entered. One can take this information and transpose it to a lower timeframe. Is the market dead on a higher timeframe? Maybe there are opportunities to play the range on a lower timeframe. Is volatility high and bias + momentum clearly directional? There may be possibilities of trading in alignment with that bias + momentum, with the expectation that market structure continues to develop in that direction.
Volatility is measured in this case using the width of the UMA channel. The current width is normalized relative to its recent range to produce a volatility state, which is then used to control the color intensity of the UMO. Because this channel is created by the average of high and low prices one can use it as a gauge for volatility. A relatively wide channel indicates that volatility is elevated compared with its recent range, while a relatively narrow channel indicates lower volatility. Because channel width can also be changing over time, a widening channel generally indicates increasing volatility, while a narrowing channel indicates decreasing volatility. All of this is visualized through a single color gradient of the UMO where a more solid color equates to greater volatility and vice versa for a fainter color.
In addition to this, I've added optional bar coloring so that you can have the indicator display one piece of information while the candles visualize something else. See images below.


I believe that covers everything. As always, thank you, and I hope this provides edge in your trading!
A quick description of how my UMA works, and how this indicator incorporates it: The UMA is a user-chosen moving average type applied across five different periods, with the resulting five averages blended together. The default option is an EMA with periods of 8, 21, 55, 144, and 233, but you could pick an SMA, a Hull MA, Zero-lag, Tillson T3, Fractal Adaptive, or several others. Additionally, you can de-blend it by making all the periods the same. If you want a 20 period SMA just make all the periods 20. In addition to this, a channel is created by calculating the UMA separately from the highs and lows. The primary UMA is the average of the resulting high and low UMAs. The UMO simply represents the rate of change—or, in practical terms, the slope—of your UMA as a histogram in a separate pane. When the average is sloping up the histogram is above zero, and vice versa when the average is sloping down. Below are a couple of screens showing both the UMA and UMO set to more commonly used moving averages. Top images is a 21 period EMA, and the bottom image is a 100 period SMA.
Now to describe the second part of the indicator, the color sources, and how they can help you when deciding about where to enter a trade, or if you should enter a trade. There are two color sources, as stated above. One depicts bias and momentum, while the other gives information about volatility. We'll start with Bias + Momentum. I define bias as closing price's relative position to the UMA channel. This is pretty obvious stuff, but above the channel high would be bullish and below the channel low is bearish, while stuck between would be defined as indecisive or a state of transition. Momentum is the rate of change of the moving average. Color is comprised of five different swatches relating to different states: bullish = bullish bias and upward momentum; weak bullish = bullish bias and downward momentum; bearish = bearish bias and downward momentum; weak bearish = bearish bias and upward momentum; and lastly, neutral is price inside the channel. How you use these color clues in combination with the directionality of the histogram and the type of UMA you've created is of course up to you. With the default settings the UMA is best used, along with market structure, as a bias guide, and that bias most of the time trumps shifts in momentum. Being aware of higher timeframe points of interest is important here because these are areas where shifts in momentum can coincide with, or precede, a change in bias—sometimes very quickly and abruptly.
The second color source, volatility, is meant to help the trader, depending on his/her trading style, make a determination about whether a trade should or should not be entered. One can take this information and transpose it to a lower timeframe. Is the market dead on a higher timeframe? Maybe there are opportunities to play the range on a lower timeframe. Is volatility high and bias + momentum clearly directional? There may be possibilities of trading in alignment with that bias + momentum, with the expectation that market structure continues to develop in that direction.
Volatility is measured in this case using the width of the UMA channel. The current width is normalized relative to its recent range to produce a volatility state, which is then used to control the color intensity of the UMO. Because this channel is created by the average of high and low prices one can use it as a gauge for volatility. A relatively wide channel indicates that volatility is elevated compared with its recent range, while a relatively narrow channel indicates lower volatility. Because channel width can also be changing over time, a widening channel generally indicates increasing volatility, while a narrowing channel indicates decreasing volatility. All of this is visualized through a single color gradient of the UMO where a more solid color equates to greater volatility and vice versa for a fainter color.
In addition to this, I've added optional bar coloring so that you can have the indicator display one piece of information while the candles visualize something else. See images below.
I believe that covers everything. As always, thank you, and I hope this provides edge in your trading!
สคริปต์แบบโอเพนซอร์ส
ด้วยเจตนารมณ์หลักของ TradingView ผู้สร้างสคริปต์นี้ได้ทำให้เป็นโอเพนซอร์ส เพื่อให้เทรดเดอร์สามารถตรวจสอบและยืนยันฟังก์ชันการทำงานของมันได้ ขอชื่นชมผู้เขียน! แม้ว่าคุณจะใช้งานได้ฟรี แต่โปรดจำไว้ว่าการเผยแพร่โค้ดซ้ำจะต้องเป็นไปตาม กฎระเบียบการใช้งาน ของเรา

คำจำกัดสิทธิ์ความรับผิดชอบ
ข้อมูลและบทความไม่ได้มีวัตถุประสงค์เพื่อก่อให้เกิดกิจกรรมทางการเงิน, การลงทุน, การซื้อขาย, ข้อเสนอแนะ หรือคำแนะนำประเภทอื่น ๆ ที่ให้หรือรับรองโดย TradingView อ่านเพิ่มเติมใน ข้อกำหนดการใช้งาน
สคริปต์แบบโอเพนซอร์ส
ด้วยเจตนารมณ์หลักของ TradingView ผู้สร้างสคริปต์นี้ได้ทำให้เป็นโอเพนซอร์ส เพื่อให้เทรดเดอร์สามารถตรวจสอบและยืนยันฟังก์ชันการทำงานของมันได้ ขอชื่นชมผู้เขียน! แม้ว่าคุณจะใช้งานได้ฟรี แต่โปรดจำไว้ว่าการเผยแพร่โค้ดซ้ำจะต้องเป็นไปตาม กฎระเบียบการใช้งาน ของเรา
คำจำกัดสิทธิ์ความรับผิดชอบ
ข้อมูลและบทความไม่ได้มีวัตถุประสงค์เพื่อก่อให้เกิดกิจกรรมทางการเงิน, การลงทุน, การซื้อขาย, ข้อเสนอแนะ หรือคำแนะนำประเภทอื่น ๆ ที่ให้หรือรับรองโดย TradingView อ่านเพิ่มเติมใน ข้อกำหนดการใช้งาน