Risk of Ruin - EMA Trend Following [Dots3Red]
💰 RISK OF RUIN & POSITION SIZING [Dots3Red]
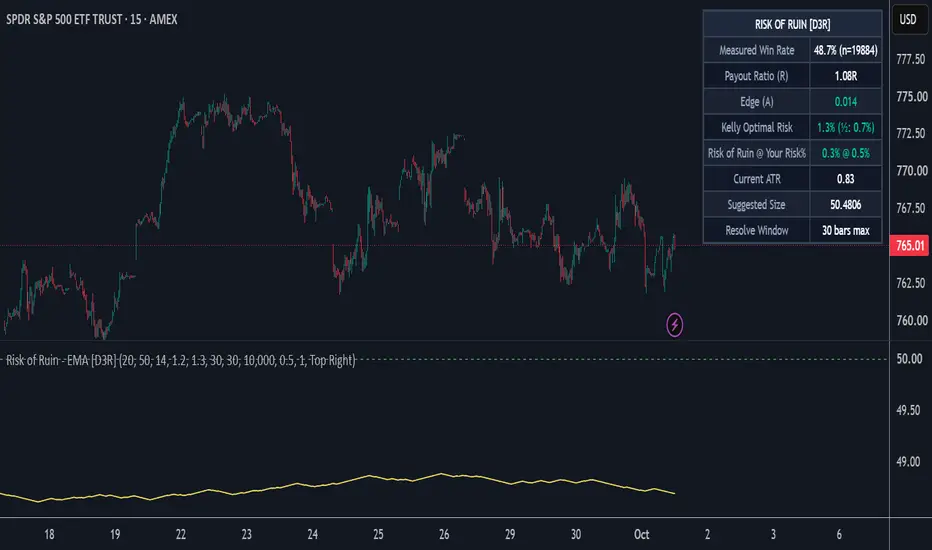
This indicator tests a simple EMA trend-following setup with an ATR-based stop and target on the current chart, measures its win rate from history, and uses that measured win rate to calculate the Kelly risk percentage, the approximate risk of ruin at your chosen risk per trade, and a suggested position size.
✨ WHY THIS MATTERS
Traders obsess over win rate and largely ignore the number that actually determines survival: how much of the account is risked per trade, given that win rate. A 55% win rate at 1% risk per trade is a very different proposition than the same win rate at 10% risk — one is a slow path to compounding, the other has a real, calculable probability of blowing the account.
Most position-sizing tools ask you to type in a win rate and payout ratio you already have to know from somewhere else. This one measures them from the chart it's running on, so the sizing math starts from observed history instead of a guess.
⚙️ HOW IT WORKS
📐 The reference system — a fast EMA vs. slow EMA defines trend direction (default 20/50). Each hypothetical entry gets an ATR-based stop (default 1×ATR, defining 1R) and an ATR-based target (default 2×ATR). It exists only to produce measurable win/loss outcomes. It is not a signal generator, and every figure in the dashboard is a statement about this specific system on this chart, not about your own trading.
🎯 Triple-barrier resolution — for every historical entry, the script walks forward through bars that have already closed to see whether the target or the stop was struck first, within your chosen window. If both are touched on the same bar, it counts as a stop, which is the conservative choice. Only fully resolved trades are counted.
🔒 Non-repainting — every trade examined is already confirmed history when it's graded; nothing shown for the past can change after the fact.
📊 Measured edge → Kelly Criterion — the measured win rate and the fixed payout ratio (target ÷ stop) combine into an edge value, then the full-Kelly and half-Kelly risk percentages for that edge.
⚠️ Risk of Ruin — using your own Risk-per-Trade setting and the measured edge, a standard simplified approximation of the probability of exhausting the account at that risk level.
🧮 Suggested position size — from your account size, risk percentage and the current ATR stop distance, the quantity that keeps a stop-out at exactly your chosen risk.
📈 The win-rate line — the line in the lower pane is the running measured win rate of the reference system as more trades resolve. It starts jumpy with few trades and settles as the sample grows. The dashed line at 50% is a coin-flip reference. Line color, thickness and visibility are adjustable, and so is the color of the 50% line.
🖥️ Dashboard on the price chart — all the figures are shown directly on the main chart so they sit next to the price action.
🧭 HOW TO USE
1️⃣ Wait for enough resolved trades. The dashboard shows "Collecting…" until enough entries have fully resolved for the win rate to mean something.
2️⃣ Check Edge (A) first. Positive means the reference system has outperformed break-even on this chart at these settings. Negative means Kelly and the risk-of-ruin math will argue against sizing up at all. With a 2R target, break-even sits at roughly a 33% win rate, so a win rate below 50% is not automatically a bad edge.
3️⃣ Compare your Risk % to Kelly. Kelly is a mathematical ceiling, not a target. If your risk setting is well above it, the Risk of Ruin reading will show it. Half-Kelly is displayed because many traders run a fraction of the full figure.
4️⃣ Use Suggested Size as a starting point. It converts your risk percentage and the current ATR into a concrete quantity. Adjust it if your real stop placement differs from a pure ATR multiple.
5️⃣ Set the reference system to resemble how you trade. A scalper's stop/target multiples and window look very different from a swing trader's. The statistics only describe your style if the reference system resembles it.
⏱️ WHICH TIMEFRAMES WORK BEST
The statistics need enough resolved trades to be meaningful, which makes 15-minute through 4-hour the most practical range. Daily charts can work on instruments with long history if you lower the minimum trades setting.
🛠️ SETTINGS
📐 Reference System — fast/slow EMA, ATR length, stop distance (× ATR), target distance (× ATR), max bars to resolve a trade, minimum trades before stats display
💰 Position Sizing — account size, risk per trade (%)
🎨 Win-Rate Line — show/hide, line color, line thickness, 50% line color
🖥️ Dashboard — show/hide, position — measured win rate (n), payout ratio, edge, Kelly optimal risk (full and half), risk of ruin at your risk %, current ATR, suggested position size, resolve window
📝 NOTES
The Risk of Ruin figure is a standard simplified approximation built on the measured edge and your settings. It is not a Monte Carlo simulation, and it is not a guarantee. All statistics are specific to this chart, this timeframe, the reference system and these settings, and do not transfer to other instruments or configurations.
⚠️ DISCLAIMER
This is an analytical and educational tool for position-sizing math. It does not generate trade signals and does not constitute financial advice. Historical statistics do not guarantee future performance, and no sizing formula eliminates the risk of loss.
This indicator tests a simple EMA trend-following setup with an ATR-based stop and target on the current chart, measures its win rate from history, and uses that measured win rate to calculate the Kelly risk percentage, the approximate risk of ruin at your chosen risk per trade, and a suggested position size.
✨ WHY THIS MATTERS
Traders obsess over win rate and largely ignore the number that actually determines survival: how much of the account is risked per trade, given that win rate. A 55% win rate at 1% risk per trade is a very different proposition than the same win rate at 10% risk — one is a slow path to compounding, the other has a real, calculable probability of blowing the account.
Most position-sizing tools ask you to type in a win rate and payout ratio you already have to know from somewhere else. This one measures them from the chart it's running on, so the sizing math starts from observed history instead of a guess.
⚙️ HOW IT WORKS
📐 The reference system — a fast EMA vs. slow EMA defines trend direction (default 20/50). Each hypothetical entry gets an ATR-based stop (default 1×ATR, defining 1R) and an ATR-based target (default 2×ATR). It exists only to produce measurable win/loss outcomes. It is not a signal generator, and every figure in the dashboard is a statement about this specific system on this chart, not about your own trading.
🎯 Triple-barrier resolution — for every historical entry, the script walks forward through bars that have already closed to see whether the target or the stop was struck first, within your chosen window. If both are touched on the same bar, it counts as a stop, which is the conservative choice. Only fully resolved trades are counted.
🔒 Non-repainting — every trade examined is already confirmed history when it's graded; nothing shown for the past can change after the fact.
📊 Measured edge → Kelly Criterion — the measured win rate and the fixed payout ratio (target ÷ stop) combine into an edge value, then the full-Kelly and half-Kelly risk percentages for that edge.
⚠️ Risk of Ruin — using your own Risk-per-Trade setting and the measured edge, a standard simplified approximation of the probability of exhausting the account at that risk level.
🧮 Suggested position size — from your account size, risk percentage and the current ATR stop distance, the quantity that keeps a stop-out at exactly your chosen risk.
📈 The win-rate line — the line in the lower pane is the running measured win rate of the reference system as more trades resolve. It starts jumpy with few trades and settles as the sample grows. The dashed line at 50% is a coin-flip reference. Line color, thickness and visibility are adjustable, and so is the color of the 50% line.
🖥️ Dashboard on the price chart — all the figures are shown directly on the main chart so they sit next to the price action.
🧭 HOW TO USE
1️⃣ Wait for enough resolved trades. The dashboard shows "Collecting…" until enough entries have fully resolved for the win rate to mean something.
2️⃣ Check Edge (A) first. Positive means the reference system has outperformed break-even on this chart at these settings. Negative means Kelly and the risk-of-ruin math will argue against sizing up at all. With a 2R target, break-even sits at roughly a 33% win rate, so a win rate below 50% is not automatically a bad edge.
3️⃣ Compare your Risk % to Kelly. Kelly is a mathematical ceiling, not a target. If your risk setting is well above it, the Risk of Ruin reading will show it. Half-Kelly is displayed because many traders run a fraction of the full figure.
4️⃣ Use Suggested Size as a starting point. It converts your risk percentage and the current ATR into a concrete quantity. Adjust it if your real stop placement differs from a pure ATR multiple.
5️⃣ Set the reference system to resemble how you trade. A scalper's stop/target multiples and window look very different from a swing trader's. The statistics only describe your style if the reference system resembles it.
⏱️ WHICH TIMEFRAMES WORK BEST
The statistics need enough resolved trades to be meaningful, which makes 15-minute through 4-hour the most practical range. Daily charts can work on instruments with long history if you lower the minimum trades setting.
🛠️ SETTINGS
📐 Reference System — fast/slow EMA, ATR length, stop distance (× ATR), target distance (× ATR), max bars to resolve a trade, minimum trades before stats display
💰 Position Sizing — account size, risk per trade (%)
🎨 Win-Rate Line — show/hide, line color, line thickness, 50% line color
🖥️ Dashboard — show/hide, position — measured win rate (n), payout ratio, edge, Kelly optimal risk (full and half), risk of ruin at your risk %, current ATR, suggested position size, resolve window
📝 NOTES
The Risk of Ruin figure is a standard simplified approximation built on the measured edge and your settings. It is not a Monte Carlo simulation, and it is not a guarantee. All statistics are specific to this chart, this timeframe, the reference system and these settings, and do not transfer to other instruments or configurations.
⚠️ DISCLAIMER
This is an analytical and educational tool for position-sizing math. It does not generate trade signals and does not constitute financial advice. Historical statistics do not guarantee future performance, and no sizing formula eliminates the risk of loss.

Connect the dots to elevate your trading.
คำจำกัดสิทธิ์ความรับผิดชอบ
ข้อมูลและบทความไม่ได้มีวัตถุประสงค์เพื่อก่อให้เกิดกิจกรรมทางการเงิน, การลงทุน, การซื้อขาย, ข้อเสนอแนะ หรือคำแนะนำประเภทอื่น ๆ ที่ให้หรือรับรองโดย TradingView อ่านเพิ่มเติมใน ข้อกำหนดการใช้งาน
Connect the dots to elevate your trading.
คำจำกัดสิทธิ์ความรับผิดชอบ
ข้อมูลและบทความไม่ได้มีวัตถุประสงค์เพื่อก่อให้เกิดกิจกรรมทางการเงิน, การลงทุน, การซื้อขาย, ข้อเสนอแนะ หรือคำแนะนำประเภทอื่น ๆ ที่ให้หรือรับรองโดย TradingView อ่านเพิ่มเติมใน ข้อกำหนดการใช้งาน