Levels Likely to Break (Zeiierman)
More exclusive indicators from Zeiierman
Subscribe to Zeiierman for $95.20/month to get exclusive indicators by this author. You pay right on TradingView and can use them on your charts straight away.
Explore Zeiierman█ Overview
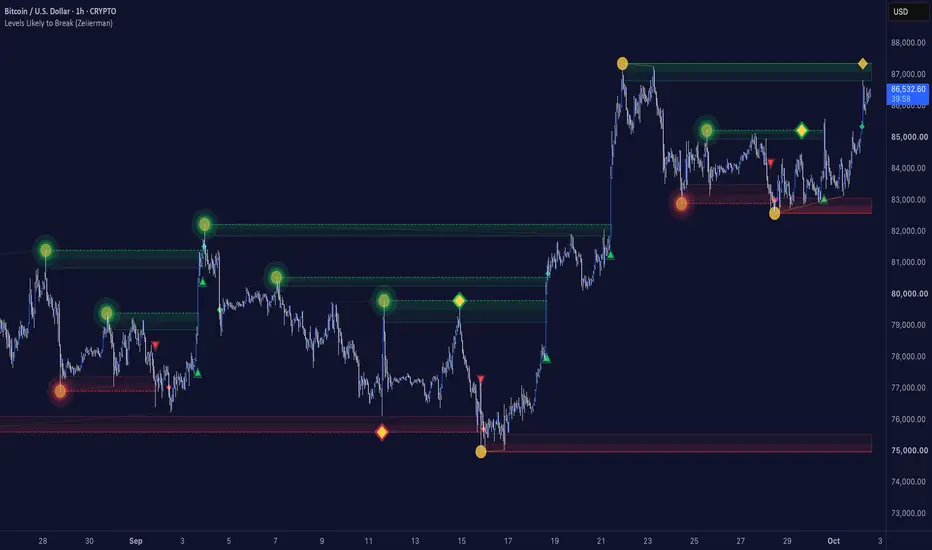
Levels Likely to Break (Zeiierman) is a market-structure and pressure-analysis indicator that identifies repeated price levels and monitors when conditions begin to build toward a potential break.
Instead of plotting every swing high and swing low as support or resistance, the indicator first looks for two confirmed pivots forming around the same price area. The first pivot becomes a hidden candidate. If a second same-side pivot forms within the selected matching tolerance and minimum spacing, the structure becomes an active level.

⚪ Assumption
The indicator is built around a simple market-structure assumption:
The more often price returns to and tests the same level, the more pressure can build against it, increasing the likelihood that the level eventually breaks.
A single pivot is therefore not enough. The indicator first looks for repeated structure around a similar price area. Once a level is confirmed, additional touches and matching pivots can increase its Break Pressure.
This keeps the focus on repeatedly tested levels that may be weakening, rather than isolated support or resistance swings.

█ How It Works
█ How to Use
Use the indicator to find repeatedly tested levels that may be more likely to break.
When a level is plotted, watch how price approaches it and look for either a breakout or fakeout around the zone.
If the level aligns with the current trend, price may move toward it and break through to continue the trend. If the break fails, the same area can also become a reversal point.
Use the pressure rings and touch markers as added confirmation that activity is building around the level.

█ Settings
-----------------
Disclaimer
The content provided in my scripts, indicators, ideas, algorithms, and systems is for educational and informational purposes only. It does not constitute financial advice, investment recommendations, or a solicitation to buy or sell any financial instruments. I will not accept liability for any loss or damage, including without limitation any loss of profit, which may arise directly or indirectly from the use of or reliance on such information.
All investments involve risk, and the past performance of a security, industry, sector, market, financial product, trading strategy, backtest, or individual's trading does not guarantee future results or returns. Investors are fully responsible for any investment decisions they make. Such decisions should be based solely on an evaluation of their financial circumstances, investment objectives, risk tolerance, and liquidity needs.
Levels Likely to Break (Zeiierman) is a market-structure and pressure-analysis indicator that identifies repeated price levels and monitors when conditions begin to build toward a potential break.
Instead of plotting every swing high and swing low as support or resistance, the indicator first looks for two confirmed pivots forming around the same price area. The first pivot becomes a hidden candidate. If a second same-side pivot forms within the selected matching tolerance and minimum spacing, the structure becomes an active level.
⚪ Assumption
The indicator is built around a simple market-structure assumption:
The more often price returns to and tests the same level, the more pressure can build against it, increasing the likelihood that the level eventually breaks.
A single pivot is therefore not enough. The indicator first looks for repeated structure around a similar price area. Once a level is confirmed, additional touches and matching pivots can increase its Break Pressure.
This keeps the focus on repeatedly tested levels that may be weakening, rather than isolated support or resistance swings.
█ How It Works
⚪ 1. Repeated Pivot Detection
The indicator starts with confirmed pivot highs and pivot lows.
The first pivot becomes a hidden candidate. A level is only created when another pivot of the same type forms close enough to the original pivot and satisfies the minimum bar spacing.Pine Script®
This means the indicator is looking for repeated structural interaction around the same price area rather than plotting every individual swing.
⚪ 2. Formation Quality
When two matching pivots qualify, the indicator evaluates the quality of the formation using price alignment, relative volume, directional pressure and absorption.Pine Script®
The confirmed level starts with two pivot confirmations and an initial Break Pressure derived from this quality.Pine Script®
⚪ 3. Dynamic Break Pressure
After the level is created, Break Pressure updates continuously as price interacts with it.
The engine measures:
• Distance from price to the level.
• Directional movement toward the level.
• Relative volume and directional pressure.
• Absorption.
• Volatility compression.
• Fresh zone touches.Pine Script®
Pressure can increase as activity builds near the level and gradually decay when price moves away.
The layered marker provides a visual representation of the current pressure state. More visible rings indicate higher Break Pressure.
⚪ 4. Level Breaks
A level remains active until price breaks beyond it or its maximum lifetime is reached.
The breakout can be based on either the wick or closing price, with an optional ATR buffer.Pine Script®
When Broken History is enabled, broken levels remain visible in a faded style and can optionally show the first qualifying retest.
█ How to Use
Use the indicator to find repeatedly tested levels that may be more likely to break.
When a level is plotted, watch how price approaches it and look for either a breakout or fakeout around the zone.
If the level aligns with the current trend, price may move toward it and break through to continue the trend. If the break fails, the same area can also become a reversal point.
Use the pressure rings and touch markers as added confirmation that activity is building around the level.
█ Settings
- Pivot Length: Controls the left/right pivot confirmation length.
- Match %: Sets how close two same-side pivots must be to qualify as the same level.
- Min Confirm Gap: Sets the minimum number of bars required between matching pivot confirmations.
- Delete After: Sets how long an unbroken active level can remain before being removed.
- Zone ATR: Controls the ATR-based depth of the active level zone.
- Pressure Sensitivity: Controls how quickly Break Pressure responds to price and volume interaction around the level.
- Break Trigger: Selects whether a level is considered broken by a Wick or by a Close beyond the level.
- Break ATR: Adds an ATR-based buffer before the level is considered broken.
-----------------
Disclaimer
The content provided in my scripts, indicators, ideas, algorithms, and systems is for educational and informational purposes only. It does not constitute financial advice, investment recommendations, or a solicitation to buy or sell any financial instruments. I will not accept liability for any loss or damage, including without limitation any loss of profit, which may arise directly or indirectly from the use of or reliance on such information.
All investments involve risk, and the past performance of a security, industry, sector, market, financial product, trading strategy, backtest, or individual's trading does not guarantee future results or returns. Investors are fully responsible for any investment decisions they make. Such decisions should be based solely on an evaluation of their financial circumstances, investment objectives, risk tolerance, and liquidity needs.

Access my indicators at: zeiierman.com
Join Our Free Discord: discord.gg/zeiiermantrading
Join Our Free Discord: discord.gg/zeiiermantrading
คำจำกัดสิทธิ์ความรับผิดชอบ
ข้อมูลและบทความไม่ได้มีวัตถุประสงค์เพื่อก่อให้เกิดกิจกรรมทางการเงิน, การลงทุน, การซื้อขาย, ข้อเสนอแนะ หรือคำแนะนำประเภทอื่น ๆ ที่ให้หรือรับรองโดย TradingView อ่านเพิ่มเติมใน ข้อกำหนดการใช้งาน
Access my indicators at: zeiierman.com
Join Our Free Discord: discord.gg/zeiiermantrading
Join Our Free Discord: discord.gg/zeiiermantrading
คำจำกัดสิทธิ์ความรับผิดชอบ
ข้อมูลและบทความไม่ได้มีวัตถุประสงค์เพื่อก่อให้เกิดกิจกรรมทางการเงิน, การลงทุน, การซื้อขาย, ข้อเสนอแนะ หรือคำแนะนำประเภทอื่น ๆ ที่ให้หรือรับรองโดย TradingView อ่านเพิ่มเติมใน ข้อกำหนดการใช้งาน