OPEN-SOURCE SCRIPT
ที่อัปเดต: Institutional Flow Scalper [IFS] v4
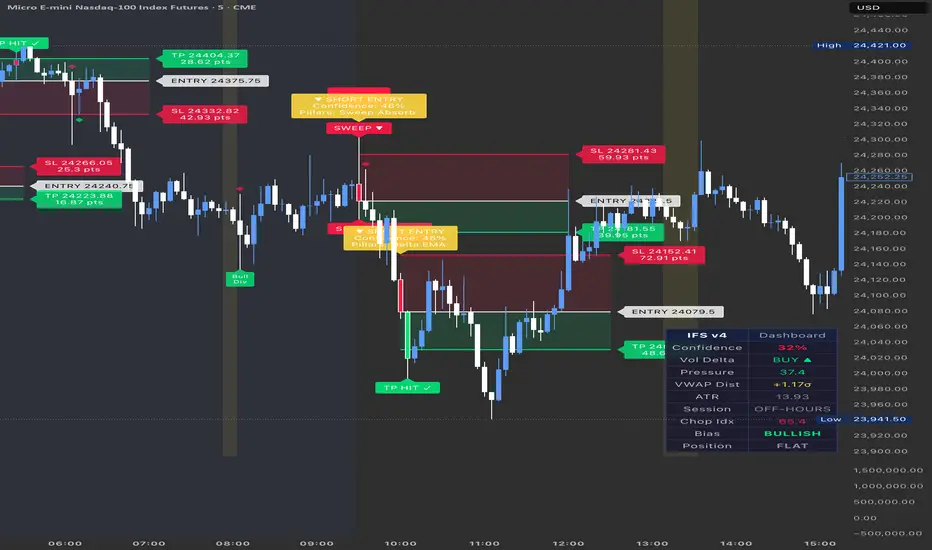
Institutional Flow Scalper [IFS]
The Institutional Flow Scalper reconstructs institutional-grade order flow analysis using only price and volume data available on TradingView. Instead of relying on traditional lagging indicators, IFS detects the footprints that large players leave in the market through volume delta imbalances, liquidity sweeps, and order absorption patterns.
HOW IT WORKS
IFS uses a multi-pillar confirmation system. A signal only fires when 2 or more independent pillars align in the same direction, reducing false signals and filtering noise.
The 7 Pillars:
1. Synthetic Volume Delta: Reconstructs buying vs selling pressure by analyzing where price closes within each bar's range, weighted by volume. This approximates what institutional platforms like Bookmap show through actual order flow.
2. Momentum Divergence: Compares the rate of change between price and cumulative volume delta. When price moves one direction but volume pressure shifts the opposite way, it signals exhaustion before the chart reflects it.
3. Liquidity Sweep Detection: Identifies stop hunts where price sweeps beyond a recent swing high/low with a volume spike, then fails to hold. This is the "smart money" concept of grabbing liquidity before reversing.
4. Order Absorption: Detects bars with abnormally high volume but small bodies, indicating a large player is absorbing aggressive orders without letting price move. This is what footprint chart traders look for as "stacked imbalances."
5. VWAP Cross & Band Bounce: Monitors price interaction with session VWAP and its standard deviation bands. Crosses and bounces from the 1-sigma bands serve as mean-reversion confirmation.
6. EMA Trend Alignment: Uses 9/21 EMA structure. Signals are strengthened when a strong directional candle appears in alignment with the EMA trend, or when an EMA crossover occurs.
7. POC Breakout: Tracks a dynamic Point of Control (volume-weighted price center) and flags when price breaks through it, indicating acceptance of a new price level.
SIGNAL FILTERS
Choppiness Index Filter: Measures whether the market is trending or ranging using the Choppiness Index. When chop is high (above threshold), all signals are suppressed to avoid overtrading in sideways conditions.
Session Filter: Signals are restricted to high-liquidity sessions (NY Morning, NY Afternoon, London) where institutional activity is concentrated and price moves have follow-through.
Confidence Score: Each bar receives a composite score from 0 to 100 based on all pillar inputs. Only bars exceeding the minimum confidence threshold generate signals.
Position Management: Only one trade can be active at a time. No new signal fires until the current trade closes via TP or SL. This prevents signal stacking and overtrading.
VISUAL FEATURES
Clear entry labels showing direction (LONG/SHORT), confidence percentage, and which pillars confirmed the trade. On entry, colored zones project forward showing the risk area (red box from entry to SL) and reward area (green box from entry to TP), with exact price levels and point distances on the labels.
Exit labels display the outcome: TP HIT, SL HIT, or MOM EXIT. All visual elements are limited to the current day's session to keep the chart clean as you scroll through history.
The dashboard displays real-time metrics: Confidence Score, Volume Delta direction, Pressure Index, VWAP distance, ATR, Session status, Chop Index, directional Bias, and current Position state.
SETTINGS OVERVIEW
Signal Engine: Sensitivity mode (Low/Medium/High/Adaptive), minimum confidence threshold.
Volume Delta Engine: CVD lookback and smoothing periods.
Liquidity Sweep: Swing point lookback, volume spike threshold.
VWAP: Band multipliers, POC lookback.
Anti-Chop Filter: Chop Index length and threshold.
Session Awareness: Configurable session windows for NY, PM, and London.
Risk Management: ATR-based TP and SL multipliers, visual line extension length.
Visual Style: Fully customizable colors for bull, bear, entry, TP, and SL elements.
RECOMMENDED USE
Designed for scalping and day trading on futures (ES, NQ, MNQ, GC, CL) and high-liquidity instruments. Optimized for 1-minute, 5-minute, and 15-minute timeframes. Works on any instrument with reliable volume data.
Use with proper risk management. Position sizing should reflect your account size and risk tolerance. Past indicator signals do not guarantee future performance.
WHAT MAKES THIS DIFFERENT
Most scalping indicators on TradingView are variations of RSI + EMA + MACD. IFS takes a fundamentally different approach by reconstructing order flow concepts (volume delta, absorption, liquidity sweeps) that institutional traders use on specialized platforms, and making them accessible within TradingView's ecosystem. The multi-pillar confirmation system ensures signals only fire when multiple independent factors align, not just when a single oscillator crosses a threshold.
The Institutional Flow Scalper reconstructs institutional-grade order flow analysis using only price and volume data available on TradingView. Instead of relying on traditional lagging indicators, IFS detects the footprints that large players leave in the market through volume delta imbalances, liquidity sweeps, and order absorption patterns.
HOW IT WORKS
IFS uses a multi-pillar confirmation system. A signal only fires when 2 or more independent pillars align in the same direction, reducing false signals and filtering noise.
The 7 Pillars:
1. Synthetic Volume Delta: Reconstructs buying vs selling pressure by analyzing where price closes within each bar's range, weighted by volume. This approximates what institutional platforms like Bookmap show through actual order flow.
2. Momentum Divergence: Compares the rate of change between price and cumulative volume delta. When price moves one direction but volume pressure shifts the opposite way, it signals exhaustion before the chart reflects it.
3. Liquidity Sweep Detection: Identifies stop hunts where price sweeps beyond a recent swing high/low with a volume spike, then fails to hold. This is the "smart money" concept of grabbing liquidity before reversing.
4. Order Absorption: Detects bars with abnormally high volume but small bodies, indicating a large player is absorbing aggressive orders without letting price move. This is what footprint chart traders look for as "stacked imbalances."
5. VWAP Cross & Band Bounce: Monitors price interaction with session VWAP and its standard deviation bands. Crosses and bounces from the 1-sigma bands serve as mean-reversion confirmation.
6. EMA Trend Alignment: Uses 9/21 EMA structure. Signals are strengthened when a strong directional candle appears in alignment with the EMA trend, or when an EMA crossover occurs.
7. POC Breakout: Tracks a dynamic Point of Control (volume-weighted price center) and flags when price breaks through it, indicating acceptance of a new price level.
SIGNAL FILTERS
Choppiness Index Filter: Measures whether the market is trending or ranging using the Choppiness Index. When chop is high (above threshold), all signals are suppressed to avoid overtrading in sideways conditions.
Session Filter: Signals are restricted to high-liquidity sessions (NY Morning, NY Afternoon, London) where institutional activity is concentrated and price moves have follow-through.
Confidence Score: Each bar receives a composite score from 0 to 100 based on all pillar inputs. Only bars exceeding the minimum confidence threshold generate signals.
Position Management: Only one trade can be active at a time. No new signal fires until the current trade closes via TP or SL. This prevents signal stacking and overtrading.
VISUAL FEATURES
Clear entry labels showing direction (LONG/SHORT), confidence percentage, and which pillars confirmed the trade. On entry, colored zones project forward showing the risk area (red box from entry to SL) and reward area (green box from entry to TP), with exact price levels and point distances on the labels.
Exit labels display the outcome: TP HIT, SL HIT, or MOM EXIT. All visual elements are limited to the current day's session to keep the chart clean as you scroll through history.
The dashboard displays real-time metrics: Confidence Score, Volume Delta direction, Pressure Index, VWAP distance, ATR, Session status, Chop Index, directional Bias, and current Position state.
SETTINGS OVERVIEW
Signal Engine: Sensitivity mode (Low/Medium/High/Adaptive), minimum confidence threshold.
Volume Delta Engine: CVD lookback and smoothing periods.
Liquidity Sweep: Swing point lookback, volume spike threshold.
VWAP: Band multipliers, POC lookback.
Anti-Chop Filter: Chop Index length and threshold.
Session Awareness: Configurable session windows for NY, PM, and London.
Risk Management: ATR-based TP and SL multipliers, visual line extension length.
Visual Style: Fully customizable colors for bull, bear, entry, TP, and SL elements.
RECOMMENDED USE
Designed for scalping and day trading on futures (ES, NQ, MNQ, GC, CL) and high-liquidity instruments. Optimized for 1-minute, 5-minute, and 15-minute timeframes. Works on any instrument with reliable volume data.
Use with proper risk management. Position sizing should reflect your account size and risk tolerance. Past indicator signals do not guarantee future performance.
WHAT MAKES THIS DIFFERENT
Most scalping indicators on TradingView are variations of RSI + EMA + MACD. IFS takes a fundamentally different approach by reconstructing order flow concepts (volume delta, absorption, liquidity sweeps) that institutional traders use on specialized platforms, and making them accessible within TradingView's ecosystem. The multi-pillar confirmation system ensures signals only fire when multiple independent factors align, not just when a single oscillator crosses a threshold.
Release Note
**Release Notes v4.1 - Real-Time Signal Execution**Signals now fire in real-time as conditions are met during the bar, instead of waiting for bar close. This eliminates the delayed entry issue where price had already moved significantly before the signal appeared, which was causing entries near the SL level. Critical fix for scalping on 1-5 minute timeframes where every second counts.
Previous trailing stop logic has been simplified. The indicator now uses clean TP and SL exits only, removing unnecessary complexity. Exit types: TP HIT, SL HIT, or MOM EXIT.
All chart visuals (entry/exit labels, TP/SL boxes, sweeps, divergences, absorption markers) are now limited to the current day's session. This keeps the chart clean when scrolling through history while maintaining full visual detail for the active trading day.
Removed Anti-Chop and Session filters from previous version and re-added them after optimization testing confirmed they are essential for signal quality. Optimized default parameters based on 5-year backtest: Confidence >= 30, Chop <= 65, Sessions NY 9:30-11:00 + PM 14:00-16:00 + London 3:00-5:00.
Position management rule enforced: no new signal fires until the current trade closes via TP or SL, preventing signal stacking.
สคริปต์โอเพนซอร์ซ
ด้วยเจตนารมณ์หลักของ TradingView ผู้สร้างสคริปต์นี้ได้ทำให้เป็นโอเพนซอร์ส เพื่อให้เทรดเดอร์สามารถตรวจสอบและยืนยันฟังก์ชันการทำงานของมันได้ ขอชื่นชมผู้เขียน! แม้ว่าคุณจะใช้งานได้ฟรี แต่โปรดจำไว้ว่าการเผยแพร่โค้ดซ้ำจะต้องเป็นไปตาม กฎระเบียบการใช้งาน ของเรา

คำจำกัดสิทธิ์ความรับผิดชอบ
ข้อมูลและบทความไม่ได้มีวัตถุประสงค์เพื่อก่อให้เกิดกิจกรรมทางการเงิน, การลงทุน, การซื้อขาย, ข้อเสนอแนะ หรือคำแนะนำประเภทอื่น ๆ ที่ให้หรือรับรองโดย TradingView อ่านเพิ่มเติมใน ข้อกำหนดการใช้งาน
สคริปต์โอเพนซอร์ซ
ด้วยเจตนารมณ์หลักของ TradingView ผู้สร้างสคริปต์นี้ได้ทำให้เป็นโอเพนซอร์ส เพื่อให้เทรดเดอร์สามารถตรวจสอบและยืนยันฟังก์ชันการทำงานของมันได้ ขอชื่นชมผู้เขียน! แม้ว่าคุณจะใช้งานได้ฟรี แต่โปรดจำไว้ว่าการเผยแพร่โค้ดซ้ำจะต้องเป็นไปตาม กฎระเบียบการใช้งาน ของเรา
คำจำกัดสิทธิ์ความรับผิดชอบ
ข้อมูลและบทความไม่ได้มีวัตถุประสงค์เพื่อก่อให้เกิดกิจกรรมทางการเงิน, การลงทุน, การซื้อขาย, ข้อเสนอแนะ หรือคำแนะนำประเภทอื่น ๆ ที่ให้หรือรับรองโดย TradingView อ่านเพิ่มเติมใน ข้อกำหนดการใช้งาน