OPEN-SOURCE SCRIPT
ที่อัปเดต: Liquidity candle
What it does
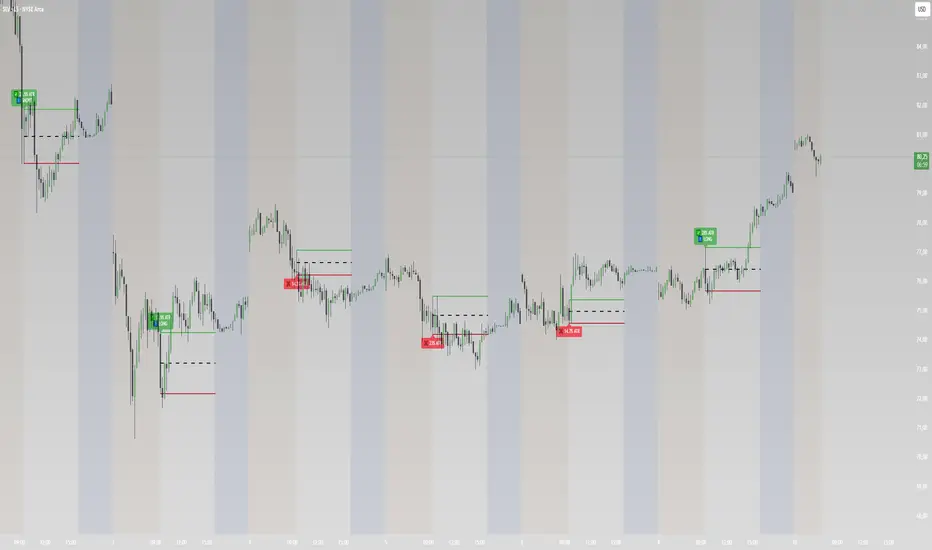
This indicator automatically identifies the first 15-minute candle of the US market session (9:30–9:45 AM New York time) and evaluates whether it qualifies as a liquidity candle by comparing its range against a percentage of the Daily ATR (Average True Range). By default, the candle is considered liquid if its range exceeds 25% of the daily ATR.
For every trading day in the chart history, it draws a colored rectangle directly on the candlestick chart spanning the exact high and low of that opening candle — green if liquid, red if not. A label displays the candle's range as a percentage of the daily ATR, and if liquid, indicates the expected trade direction (LONG or SHORT) based on the candle's close.
What it shows
✅ Green rectangle — The opening candle is liquid. Price moved enough to suggest institutional activity and a potential "touch and turn" reversal setup.
❌ Red rectangle — The opening candle lacks sufficient range. The session may be slow or directionless — no trade setup.
% of ATR — Tells you exactly how significant the opening move was relative to the average daily range.
Direction label — A bullish opening candle signals a potential SHORT reversal. A bearish opening candle signals a potential LONG reversal.
How to use it in a strategy
The core idea behind this indicator is the "Touch and Turn" scalping concept. Large opening candles often represent a liquidity sweep — smart money pushing price aggressively in one direction to collect orders before reversing. The indicator helps you:
Filter low-quality days — If the rectangle is red, skip the session entirely. No liquidity means no clean setup.
Identify your bias — A green rectangle with a SHORT label means you are looking to sell when price returns to the high of the opening candle. A LONG label means you buy a retest of the low.
Plan your entry — Wait for price to retrace back into the rectangle zone after 9:45 AM. The high or low of the rectangle acts as your entry trigger.
Set your targets — Use the Fibonacci 38.2% level drawn from the opening candle range to place your take profit, with a stop loss at a 2:1 risk-to-reward ratio beyond your entry.
Build confluence — Combine this indicator with your existing tools (RSI, MACD, EMAs) visible on your chart. A liquid opening candle aligned with an overbought RSI or a bearish MACD cross strengthens the SHORT signal significantly.
This indicator automatically identifies the first 15-minute candle of the US market session (9:30–9:45 AM New York time) and evaluates whether it qualifies as a liquidity candle by comparing its range against a percentage of the Daily ATR (Average True Range). By default, the candle is considered liquid if its range exceeds 25% of the daily ATR.
For every trading day in the chart history, it draws a colored rectangle directly on the candlestick chart spanning the exact high and low of that opening candle — green if liquid, red if not. A label displays the candle's range as a percentage of the daily ATR, and if liquid, indicates the expected trade direction (LONG or SHORT) based on the candle's close.
What it shows
✅ Green rectangle — The opening candle is liquid. Price moved enough to suggest institutional activity and a potential "touch and turn" reversal setup.
❌ Red rectangle — The opening candle lacks sufficient range. The session may be slow or directionless — no trade setup.
% of ATR — Tells you exactly how significant the opening move was relative to the average daily range.
Direction label — A bullish opening candle signals a potential SHORT reversal. A bearish opening candle signals a potential LONG reversal.
How to use it in a strategy
The core idea behind this indicator is the "Touch and Turn" scalping concept. Large opening candles often represent a liquidity sweep — smart money pushing price aggressively in one direction to collect orders before reversing. The indicator helps you:
Filter low-quality days — If the rectangle is red, skip the session entirely. No liquidity means no clean setup.
Identify your bias — A green rectangle with a SHORT label means you are looking to sell when price returns to the high of the opening candle. A LONG label means you buy a retest of the low.
Plan your entry — Wait for price to retrace back into the rectangle zone after 9:45 AM. The high or low of the rectangle acts as your entry trigger.
Set your targets — Use the Fibonacci 38.2% level drawn from the opening candle range to place your take profit, with a stop loss at a 2:1 risk-to-reward ratio beyond your entry.
Build confluence — Combine this indicator with your existing tools (RSI, MACD, EMAs) visible on your chart. A liquid opening candle aligned with an overbought RSI or a bearish MACD cross strengthens the SHORT signal significantly.
Release Note
Changelog — Liquidity Candle indicator1. Configurable candle timeframe
The candle used for analysis is no longer hardcoded to 15 minutes. You can now select any timeframe (1m, 3m, 5m, 10m, 15m, 30m, 1h, 4h) directly from the settings panel.
2. Session / target time selector
Instead of being locked to New York 9:30, you can now pick from five preset sessions: New York 9:30, New York 8:00, London 3:00 (Asian killzone close), London 8:00 (London open), and Tokyo 19:00. Each preset automatically applies the correct timezone, so no manual timezone management is needed.
3. Custom time option
If none of the presets match your needs, a "Custom" option lets you manually define the exact hour, minute, and timezone (New York, London, Tokyo, Paris, or Chicago).
4. ATR threshold remains fully adjustable
The 25% ATR filter is unchanged in logic but stays editable via the "Seuil (%)" input — set it to 0.25 for 25%, 0.50 for 50%, etc.
สคริปต์โอเพนซอร์ซ
ด้วยเจตนารมณ์หลักของ TradingView ผู้สร้างสคริปต์นี้ได้ทำให้เป็นโอเพนซอร์ส เพื่อให้เทรดเดอร์สามารถตรวจสอบและยืนยันฟังก์ชันการทำงานของมันได้ ขอชื่นชมผู้เขียน! แม้ว่าคุณจะใช้งานได้ฟรี แต่โปรดจำไว้ว่าการเผยแพร่โค้ดซ้ำจะต้องเป็นไปตาม กฎระเบียบการใช้งาน ของเรา

คำจำกัดสิทธิ์ความรับผิดชอบ
ข้อมูลและบทความไม่ได้มีวัตถุประสงค์เพื่อก่อให้เกิดกิจกรรมทางการเงิน, การลงทุน, การซื้อขาย, ข้อเสนอแนะ หรือคำแนะนำประเภทอื่น ๆ ที่ให้หรือรับรองโดย TradingView อ่านเพิ่มเติมใน ข้อกำหนดการใช้งาน
สคริปต์โอเพนซอร์ซ
ด้วยเจตนารมณ์หลักของ TradingView ผู้สร้างสคริปต์นี้ได้ทำให้เป็นโอเพนซอร์ส เพื่อให้เทรดเดอร์สามารถตรวจสอบและยืนยันฟังก์ชันการทำงานของมันได้ ขอชื่นชมผู้เขียน! แม้ว่าคุณจะใช้งานได้ฟรี แต่โปรดจำไว้ว่าการเผยแพร่โค้ดซ้ำจะต้องเป็นไปตาม กฎระเบียบการใช้งาน ของเรา
คำจำกัดสิทธิ์ความรับผิดชอบ
ข้อมูลและบทความไม่ได้มีวัตถุประสงค์เพื่อก่อให้เกิดกิจกรรมทางการเงิน, การลงทุน, การซื้อขาย, ข้อเสนอแนะ หรือคำแนะนำประเภทอื่น ๆ ที่ให้หรือรับรองโดย TradingView อ่านเพิ่มเติมใน ข้อกำหนดการใช้งาน