OPEN-SOURCE SCRIPT
ที่อัปเดต: Bias Dashboard
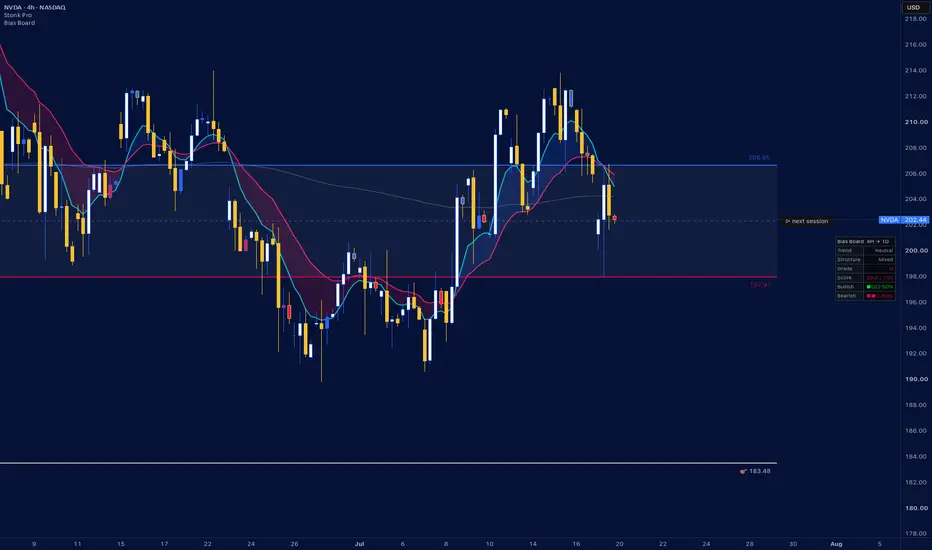
Bias Dashboard
Bias Dashboard is a clean, dashboard-only indicator designed to quickly show the current directional strength of any chart.
It analyzes trend structure, momentum, RSI, DMI/ADX, price location, market structure, and higher-timeframe confirmation to calculate a bullish and bearish bias.
The dashboard displays:
Trend: Bullish, Bearish, or Neutral
Grade: A+ through D based on directional strength
Score: Overall trend conviction from 0–100
Bullish Meter: Current bullish pressure
Bearish Meter: Current bearish pressure
This indicator does not generate entries, stop losses, take-profit targets, or chart levels. It is intended to provide a quick market-bias overview that can be used alongside your own trading strategy.
The dashboard position, size, title, colors, EMA settings, scoring sensitivity, and higher timeframe can all be customized.
How to use it
A higher bullish score suggests buyers are currently in control, while a higher bearish score suggests sellers are in control. Higher grades indicate stronger directional alignment across the indicator’s confirmation factors.
A strong grade does not automatically mean price should be entered immediately. Traders should still wait for their preferred setup, confirmation, and risk-management conditions.
Works on stocks, ETFs, forex, futures, and cryptocurrencies across all chart timeframes.
For educational purposes only. Not financial advice.
Bias Dashboard is a clean, dashboard-only indicator designed to quickly show the current directional strength of any chart.
It analyzes trend structure, momentum, RSI, DMI/ADX, price location, market structure, and higher-timeframe confirmation to calculate a bullish and bearish bias.
The dashboard displays:
Trend: Bullish, Bearish, or Neutral
Grade: A+ through D based on directional strength
Score: Overall trend conviction from 0–100
Bullish Meter: Current bullish pressure
Bearish Meter: Current bearish pressure
This indicator does not generate entries, stop losses, take-profit targets, or chart levels. It is intended to provide a quick market-bias overview that can be used alongside your own trading strategy.
The dashboard position, size, title, colors, EMA settings, scoring sensitivity, and higher timeframe can all be customized.
How to use it
A higher bullish score suggests buyers are currently in control, while a higher bearish score suggests sellers are in control. Higher grades indicate stronger directional alignment across the indicator’s confirmation factors.
A strong grade does not automatically mean price should be entered immediately. Traders should still wait for their preferred setup, confirmation, and risk-management conditions.
Works on stocks, ETFs, forex, futures, and cryptocurrencies across all chart timeframes.
For educational purposes only. Not financial advice.
Release Note
Reduced the meters from 10 blocks to 5 blocks by default and removed the decimal from the percentages, so they take up much less horizontal space on mobile.You can also adjust Meter Blocks between 3 and 10 in the dashboard settings.
Release Note
The 50 EMA is now included behind the scenes without adding any dashboard rows or increasing its size.It now checks the 8, 21, 50, and 200 EMA structure on both the chart timeframe and confirmation timeframe. The 50 EMA receives moderate weighting so temporary bounces are less likely to flip the bias prematurely.
Release Note
The Structure row is designed to ignore insignificant internal pivots.Instead of labeling every small movement as a higher high or lower low, the indicator uses confirmed alternating swing points and requires a minimum ATR-based move between swings. This helps prevent minor chart noise from incorrectly changing the broader structure reading.
Swing sensitivity and the required ATR movement can be adjusted in the settings. The default settings are especially solid for 15-minute, 1-hour, and 4-hour charts. On a 4-hour chart, the board automatically uses the daily timeframe for confirmation.
How to use it
The strongest alignment occurs when the Trend, Structure, Grade, and dominant meter agree.
For example:
Bullish + HL/HH: Bullish structure supports the directional bias
Bearish + LH/LL: Bearish structure supports the directional bias
Bullish trend + LH: Possible bounce, pullback, or conflicting structure
Bearish trend + HL: Possible stabilization or early reversal attempt
The score represents directional conviction, not the exact probability of a future price move.
Release Note
Bugs.Release Note
.Release Note
Entry-timeframe-to-bias-timeframe system fixed. สคริปต์โอเพนซอร์ซ
ด้วยเจตนารมณ์หลักของ TradingView ผู้สร้างสคริปต์นี้ได้ทำให้เป็นโอเพนซอร์ส เพื่อให้เทรดเดอร์สามารถตรวจสอบและยืนยันฟังก์ชันการทำงานของมันได้ ขอชื่นชมผู้เขียน! แม้ว่าคุณจะใช้งานได้ฟรี แต่โปรดจำไว้ว่าการเผยแพร่โค้ดซ้ำจะต้องเป็นไปตาม กฎระเบียบการใช้งาน ของเรา

คำจำกัดสิทธิ์ความรับผิดชอบ
ข้อมูลและบทความไม่ได้มีวัตถุประสงค์เพื่อก่อให้เกิดกิจกรรมทางการเงิน, การลงทุน, การซื้อขาย, ข้อเสนอแนะ หรือคำแนะนำประเภทอื่น ๆ ที่ให้หรือรับรองโดย TradingView อ่านเพิ่มเติมใน ข้อกำหนดการใช้งาน
สคริปต์โอเพนซอร์ซ
ด้วยเจตนารมณ์หลักของ TradingView ผู้สร้างสคริปต์นี้ได้ทำให้เป็นโอเพนซอร์ส เพื่อให้เทรดเดอร์สามารถตรวจสอบและยืนยันฟังก์ชันการทำงานของมันได้ ขอชื่นชมผู้เขียน! แม้ว่าคุณจะใช้งานได้ฟรี แต่โปรดจำไว้ว่าการเผยแพร่โค้ดซ้ำจะต้องเป็นไปตาม กฎระเบียบการใช้งาน ของเรา
คำจำกัดสิทธิ์ความรับผิดชอบ
ข้อมูลและบทความไม่ได้มีวัตถุประสงค์เพื่อก่อให้เกิดกิจกรรมทางการเงิน, การลงทุน, การซื้อขาย, ข้อเสนอแนะ หรือคำแนะนำประเภทอื่น ๆ ที่ให้หรือรับรองโดย TradingView อ่านเพิ่มเติมใน ข้อกำหนดการใช้งาน