OPEN-SOURCE SCRIPT
Integrated Execution System [JOAT]
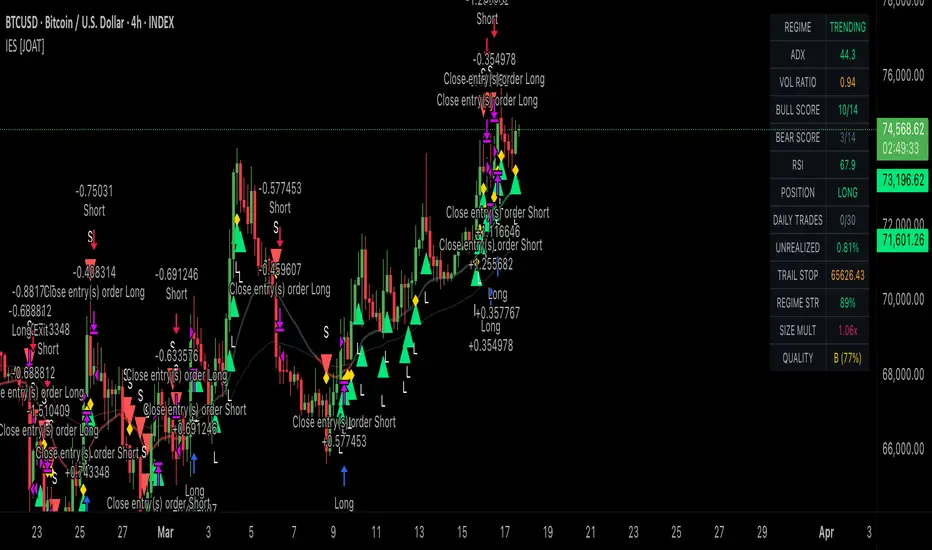
Integrated Execution Strategy System
Introduction
The Integrated Execution Strategy System is a comprehensive open-source trading strategy that combines regime detection, directional bias analysis, momentum filtering, and structural confluence into a unified adaptive trading framework. This strategy is designed for traders who understand that successful trading requires adapting to market conditions and waiting for high-probability setups with multiple layers of confirmation.
Unlike simple strategies that rely on single indicators, this system integrates six distinct analytical layers: Market Regime Classification to avoid unfavorable conditions, Directional Bias Aggregation across multiple timeframes, Momentum Pressure analysis to gauge institutional participation, Structural Analysis for key levels, Volatility Engine for adaptive sizing, and Signal Qualification to ensure only the highest probability setups are taken. The strategy is built on the principle that edges in trading come from the confluence of multiple factors, not from any single signal.
[image[
Why This Strategy Exists
This strategy addresses the critical challenge most traders face: adapting to changing market conditions. Most strategies work well in specific market regimes but fail when conditions change. This system solves that problem by:
Each component addresses a specific aspect of trading: Regime detection tells us WHEN to trade, bias analysis tells us WHICH direction, momentum confirms the STRENGTH, structure provides the LEVEL, volatility determines the SIZE, and qualification ensures the QUALITY of the setup.
Core Components Explained
1. Market Regime Detection
The strategy classifies markets into four distinct regimes using ADX and ATR analysis:
Pine Script®
Regime types:
The strategy automatically reduces position sizing and tightens stops in volatile regimes while increasing size and allowing wider stops in trending regimes.
2. Directional Bias Aggregation
Bias is calculated using multiple indicators weighted by their reliability:
Pine Script®
Bias components:
A bias score above the threshold (default 30) indicates directional conviction worth trading.
3. Momentum Pressure Analysis
Momentum is evaluated through multiple oscillators to ensure entry timing:
Pine Script®
Momentum filters:
Only when momentum aligns with directional bias do we consider entries.
4. Structural Market Analysis
Structure identifies key levels where institutions place orders:
Pine Script®
Structural elements:
Entries are favored when price aligns with structural levels and sweeps indicate institutional activity.
5. Volatility-Adaptive Risk Management
Risk management dynamically adjusts based on market conditions:
Pine Script®
Risk features:
6. Signal Qualification System
The strategy uses a 14-point qualification system to ensure only high-quality setups:
Pine Script®
Qualification criteria:
Only setups scoring 5+ (adjustable) are considered for trading.
Visual Elements
The dashboard displays:
1. Current market regime and strength
2. Directional bias score and alignment
3. Momentum state and pressure readings
4. Structural analysis and proximity to levels
5. Signal qualification score and grade
6. Active position sizing and risk metrics
7. Multi-timeframe alignment status
Input Parameters
Regime Detection:
Bias Calculation:
Risk Management:
Signal Filters:
How to Use This Strategy
Step 1: Understand Market Regime
Check the dashboard for current market regime. Avoid trading in volatile regimes (red background) unless you have specific volatility-based strategies. Trending regimes (green) are optimal for directional trading, while ranging regimes (purple) suit mean-reversion approaches.
Step 2: Assess Directional Bias
Look for strong bias scores (60+) with multi-timeframe alignment. The bias should be clear across multiple timeframes before considering entries. Weak or conflicting bias suggests waiting for clarity.
Step 3: Confirm Momentum
Ensure momentum indicators support the directional bias. Look for RSI momentum in the direction of the trade, MACD histogram expanding, and stochastic crossovers aligned with the bias.
Step 4: Identify Structural Levels
Entries near structural levels (swing highs/lows) have higher probability. Look for liquidity sweeps that indicate institutional participation before entering in the opposite direction.
Step 5: Check Signal Qualification
Only take trades with qualification scores of 5 or higher. Premium signals (grade A, 75+ quality) offer the highest probability and can be sized more aggressively.
Step 6: Manage Risk Dynamically
Let the strategy's adaptive risk management adjust position sizes and stops based on market conditions. Don't override the system's risk calculations without strong reason.
Best Practices
Strategy Limitations
Technical Implementation
Built with Pine Script v6 featuring:
The code is fully open-source and can be modified to suit individual trading styles and preferences. All calculations use confirmed bars to prevent repainting.
Originality Statement
This strategy is original in its comprehensive integration of multiple analytical layers into a unified adaptive system. While individual components (ADX, moving averages, RSI, MACD, etc.) are established tools, this strategy is justified because:
The strategy's value lies not in any single component but in how these elements work together to create a robust, adaptive trading system that can navigate different market environments while maintaining disciplined risk management.
Disclaimer
This strategy is provided for educational and informational purposes only. It is not financial advice or a recommendation to buy or sell any financial instrument. Trading involves substantial risk of loss and is not suitable for all investors.
Past performance does not guarantee future results. The backtested results shown are based on historical data and do not account for real-world factors such as slippage, liquidity issues, or psychological pressures that can affect trading performance.
The strategy's signals are mathematical calculations based on historical patterns and technical indicators. They do not predict future price movements with certainty. Market conditions can change rapidly, rendering previously successful patterns ineffective.
Always use proper risk management, including stop losses and position sizing appropriate for your account size and risk tolerance. Never risk more than you can afford to lose. Consider consulting with a qualified financial advisor before making investment decisions.
The author is not responsible for any losses incurred from using this strategy. Users assume full responsibility for all trading decisions made using this system.
-Made with passion by officialjackofalltrades
Introduction
The Integrated Execution Strategy System is a comprehensive open-source trading strategy that combines regime detection, directional bias analysis, momentum filtering, and structural confluence into a unified adaptive trading framework. This strategy is designed for traders who understand that successful trading requires adapting to market conditions and waiting for high-probability setups with multiple layers of confirmation.
Unlike simple strategies that rely on single indicators, this system integrates six distinct analytical layers: Market Regime Classification to avoid unfavorable conditions, Directional Bias Aggregation across multiple timeframes, Momentum Pressure analysis to gauge institutional participation, Structural Analysis for key levels, Volatility Engine for adaptive sizing, and Signal Qualification to ensure only the highest probability setups are taken. The strategy is built on the principle that edges in trading come from the confluence of multiple factors, not from any single signal.
[image[
Why This Strategy Exists
This strategy addresses the critical challenge most traders face: adapting to changing market conditions. Most strategies work well in specific market regimes but fail when conditions change. This system solves that problem by:
- Regime-Adaptive Logic: Automatically detects trending, ranging, and volatile market conditions and adjusts trading behavior accordingly
- Multi-Layer Filtering: Requires confluence across trend, momentum, structure, and volume before entering trades
- Institutional-Grade Risk Management: Dynamic position sizing, adaptive stops, and multi-target scaling based on market volatility
- Multi-Timeframe Alignment: Confirms signals across higher timeframes to trade with the dominant market flow
- Pressure and Flow Analysis: Measures buying/selling pressure to detect institutional participation
- Structural Confluence: Identifies key swing levels and liquidity zones for optimal entry positioning
Each component addresses a specific aspect of trading: Regime detection tells us WHEN to trade, bias analysis tells us WHICH direction, momentum confirms the STRENGTH, structure provides the LEVEL, volatility determines the SIZE, and qualification ensures the QUALITY of the setup.
Core Components Explained
1. Market Regime Detection
The strategy classifies markets into four distinct regimes using ADX and ATR analysis:
Regime types:
- Trending (ADX > 25): Strong directional markets with momentum
- Ranging (Low volatility, ADX < 25): Sideways markets suitable for range-bound strategies
- Volatile (High volatility, ADX < 25): Chaotic markets where trading is reduced or avoided
- Neutral: Transition periods between defined regimes
The strategy automatically reduces position sizing and tightens stops in volatile regimes while increasing size and allowing wider stops in trending regimes.
2. Directional Bias Aggregation
Bias is calculated using multiple indicators weighted by their reliability:
Bias components:
- Moving Average Relationships: Fast/slow MA alignment for trend direction
- Price Position: Where price sits relative to key moving averages
- ADX Directional Indicators: +DI vs -DI for momentum confirmation
- Multi-Timeframe Alignment: Higher timeframe bias for trend confirmation
A bias score above the threshold (default 30) indicates directional conviction worth trading.
3. Momentum Pressure Analysis
Momentum is evaluated through multiple oscillators to ensure entry timing:
Momentum filters:
- RSI Analysis: Momentum direction and overbought/oversold conditions
- MACD Histogram: Trend acceleration and deceleration
- Stochastic Oscillator: Entry timing and momentum strength
- Volume Confirmation: Above-average volume for signal validity
Only when momentum aligns with directional bias do we consider entries.
4. Structural Market Analysis
Structure identifies key levels where institutions place orders:
Structural elements:
- Swing Points: Key highs and lows that define market structure
- Liquidity Sweeps: Price moves beyond swing levels that quickly reverse
- Break of Structure: Confirmation of trend changes
- Support/Resistance Zones: Areas of high probability reaction
Entries are favored when price aligns with structural levels and sweeps indicate institutional activity.
5. Volatility-Adaptive Risk Management
Risk management dynamically adjusts based on market conditions:
Risk features:
- Adaptive Position Sizing: Larger sizes in high-conviction trends, smaller in volatile conditions
- Dynamic Stop Losses: Wider in trending markets, tighter in ranging/volatile conditions
- Multi-Target Scaling: Partial profits at predefined levels to reduce risk
- Trailing Stops: Lock in profits when moves reach predefined thresholds
- Volatility-Adjusted Targets: Larger profit targets in high-volatility environments
6. Signal Qualification System
The strategy uses a 14-point qualification system to ensure only high-quality setups:
Qualification criteria:
- Bias Strength (3 points): Strong directional conviction
- Momentum (3 points): Multiple momentum indicators aligned
- Structure (2 points): Price respecting key levels
- Regime (2 points): Favorable market conditions
- Pressure (1 point): Buying/selling pressure confirmation
- Sweeps (1 point): Liquidity sweep patterns
- Squeeze Release (1 point): Volatility breakout patterns
- MTF Alignment (1 point): Higher timeframe confirmation
Only setups scoring 5+ (adjustable) are considered for trading.
Visual Elements
- Directional Cloud: Dynamic cloud showing trend direction and strength
- Signal Markers: Clear entry signals with quality grades (A-D)
- Risk Levels: Visual stop loss and target levels
- Structure Points: Marked swing highs and lows
- Background Colors: Regime-based background shading
- Dashboard: Real-time metrics including regime, bias, momentum, and signal quality
The dashboard displays:
1. Current market regime and strength
2. Directional bias score and alignment
3. Momentum state and pressure readings
4. Structural analysis and proximity to levels
5. Signal qualification score and grade
6. Active position sizing and risk metrics
7. Multi-timeframe alignment status
Input Parameters
Regime Detection:
- ADX Period: Trend strength calculation period (default: 14)
- Trend Threshold: Minimum ADX for trend regime (default: 25)
- ATR Period: Volatility calculation period (default: 14)
- Volatility Expansion/Contraction: Multipliers for regime detection (default: 1.4/0.6)
Bias Calculation:
- Fast/Slow/Anchor MAs: Trend calculation periods (default: 21/55/200)
- Bias Threshold: Minimum score for directional bias (default: 30)
- Multi-Timeframe Settings: Higher timeframes for confirmation (default: 60m/240m/1D)
Risk Management:
- Risk Per Trade %: Percentage of equity to risk (default: 1.0%)
- ATR Stop Multiplier: Stop distance in ATR units (default: 2.0)
- R:R Targets: Profit target multiples (default: 1.5x/2.5x)
- Adaptive Sizing: Enable regime-based position sizing (default: true)
Signal Filters:
- Minimum Qualification Score: Required confluence score (default: 5)
- Signal Cooldown: Bars between signals (default: 1)
- Volume Filter: Require above-average volume (default: true)
- Bar Confirmation: Wait for bar close (default: true)
How to Use This Strategy
Step 1: Understand Market Regime
Check the dashboard for current market regime. Avoid trading in volatile regimes (red background) unless you have specific volatility-based strategies. Trending regimes (green) are optimal for directional trading, while ranging regimes (purple) suit mean-reversion approaches.
Step 2: Assess Directional Bias
Look for strong bias scores (60+) with multi-timeframe alignment. The bias should be clear across multiple timeframes before considering entries. Weak or conflicting bias suggests waiting for clarity.
Step 3: Confirm Momentum
Ensure momentum indicators support the directional bias. Look for RSI momentum in the direction of the trade, MACD histogram expanding, and stochastic crossovers aligned with the bias.
Step 4: Identify Structural Levels
Entries near structural levels (swing highs/lows) have higher probability. Look for liquidity sweeps that indicate institutional participation before entering in the opposite direction.
Step 5: Check Signal Qualification
Only take trades with qualification scores of 5 or higher. Premium signals (grade A, 75+ quality) offer the highest probability and can be sized more aggressively.
Step 6: Manage Risk Dynamically
Let the strategy's adaptive risk management adjust position sizes and stops based on market conditions. Don't override the system's risk calculations without strong reason.
Best Practices
- Trade liquid instruments (major forex pairs, indices, large-cap stocks, major crypto) for reliable signals
- Start with the default parameters and only adjust after understanding their impact
- Pay attention to regime changes - they often signal strategy adjustments
- Use the qualification score as your primary filter - higher scores mean higher probability
- Be patient for A-grade setups rather than forcing mediocre trades
- Monitor the multi-timeframe alignment - trades against higher timeframes have lower success rates
- Let winners run to the second target when momentum is strong
- Reduce size during volatile regimes or take a break entirely
- Keep a trade journal to note which regime/bias combinations work best for each instrument
- Consider economic news events that might trigger regime changes
Strategy Limitations
- Like all strategies, performance varies across different market instruments and timeframes
- Regime detection may lag during rapid market transitions
- Multi-timeframe analysis requires sufficient historical data on all timeframes
- The strategy is designed for swing trading and may not be optimal for scalping
- Highly correlated instruments may produce similar signals across different pairs
- Extreme market events (black swans) can overwhelm any risk management system
- Backtested performance does not guarantee future results
- The strategy requires discipline to follow all signals, including losing ones
- Commissions and slippage can significantly impact performance on smaller timeframes
- Success requires understanding the system's logic rather than blind execution
Technical Implementation
Built with Pine Script v6 featuring:
- Modular architecture with separate calculation modules for each component
- Advanced regime detection using ADX and ATR combinations
- Multi-timeframe security requests with proper lookahead management
- Dynamic risk management with adaptive position sizing
- Comprehensive signal qualification scoring system
- Real-time dashboard with 12 key metrics
- Visual elements including directional cloud and risk levels
- Export functions for integration with other indicators
- Alert conditions for all major signal types
The code is fully open-source and can be modified to suit individual trading styles and preferences. All calculations use confirmed bars to prevent repainting.
Originality Statement
This strategy is original in its comprehensive integration of multiple analytical layers into a unified adaptive system. While individual components (ADX, moving averages, RSI, MACD, etc.) are established tools, this strategy is justified because:
- It synthesizes six distinct analytical approaches into a cohesive decision framework
- The regime-adaptive logic automatically adjusts strategy behavior based on market conditions
- The qualification scoring system provides objective criteria for signal selection
- Multi-timeframe bias aggregation ensures alignment with the dominant market trend
- Structural analysis integration provides context for market microstructure
- Volatility-adaptive risk management dynamically adjusts to market conditions
- The comprehensive dashboard presents all critical metrics for informed decision-making
- Each component contributes unique information: regime tells us when to trade, bias tells us direction, momentum provides timing, structure gives levels, volatility determines sizing, and qualification ensures quality
The strategy's value lies not in any single component but in how these elements work together to create a robust, adaptive trading system that can navigate different market environments while maintaining disciplined risk management.
Disclaimer
This strategy is provided for educational and informational purposes only. It is not financial advice or a recommendation to buy or sell any financial instrument. Trading involves substantial risk of loss and is not suitable for all investors.
Past performance does not guarantee future results. The backtested results shown are based on historical data and do not account for real-world factors such as slippage, liquidity issues, or psychological pressures that can affect trading performance.
The strategy's signals are mathematical calculations based on historical patterns and technical indicators. They do not predict future price movements with certainty. Market conditions can change rapidly, rendering previously successful patterns ineffective.
Always use proper risk management, including stop losses and position sizing appropriate for your account size and risk tolerance. Never risk more than you can afford to lose. Consider consulting with a qualified financial advisor before making investment decisions.
The author is not responsible for any losses incurred from using this strategy. Users assume full responsibility for all trading decisions made using this system.
-Made with passion by officialjackofalltrades
สคริปต์แบบโอเพนซอร์ส
ด้วยเจตนารมณ์หลักของ TradingView ผู้สร้างสคริปต์นี้ได้ทำให้เป็นโอเพนซอร์ส เพื่อให้เทรดเดอร์สามารถตรวจสอบและยืนยันฟังก์ชันการทำงานของมันได้ ขอชื่นชมผู้เขียน! แม้ว่าคุณจะใช้งานได้ฟรี แต่โปรดจำไว้ว่าการเผยแพร่โค้ดซ้ำจะต้องเป็นไปตาม กฎระเบียบการใช้งาน ของเรา

The Institutional Grade Trading Ecosystem, Built to win trades 📈
Get Access 👇
jackofalltrades.vip 🌐
t.me/jackofalltradesvip 🃏
Get Access 👇
jackofalltrades.vip 🌐
t.me/jackofalltradesvip 🃏
คำจำกัดสิทธิ์ความรับผิดชอบ
ข้อมูลและบทความไม่ได้มีวัตถุประสงค์เพื่อก่อให้เกิดกิจกรรมทางการเงิน, การลงทุน, การซื้อขาย, ข้อเสนอแนะ หรือคำแนะนำประเภทอื่น ๆ ที่ให้หรือรับรองโดย TradingView อ่านเพิ่มเติมใน ข้อกำหนดการใช้งาน
สคริปต์แบบโอเพนซอร์ส
ด้วยเจตนารมณ์หลักของ TradingView ผู้สร้างสคริปต์นี้ได้ทำให้เป็นโอเพนซอร์ส เพื่อให้เทรดเดอร์สามารถตรวจสอบและยืนยันฟังก์ชันการทำงานของมันได้ ขอชื่นชมผู้เขียน! แม้ว่าคุณจะใช้งานได้ฟรี แต่โปรดจำไว้ว่าการเผยแพร่โค้ดซ้ำจะต้องเป็นไปตาม กฎระเบียบการใช้งาน ของเรา
The Institutional Grade Trading Ecosystem, Built to win trades 📈
Get Access 👇
jackofalltrades.vip 🌐
t.me/jackofalltradesvip 🃏
Get Access 👇
jackofalltrades.vip 🌐
t.me/jackofalltradesvip 🃏
คำจำกัดสิทธิ์ความรับผิดชอบ
ข้อมูลและบทความไม่ได้มีวัตถุประสงค์เพื่อก่อให้เกิดกิจกรรมทางการเงิน, การลงทุน, การซื้อขาย, ข้อเสนอแนะ หรือคำแนะนำประเภทอื่น ๆ ที่ให้หรือรับรองโดย TradingView อ่านเพิ่มเติมใน ข้อกำหนดการใช้งาน