OPEN-SOURCE SCRIPT
Multi-Timeframe Trend Table
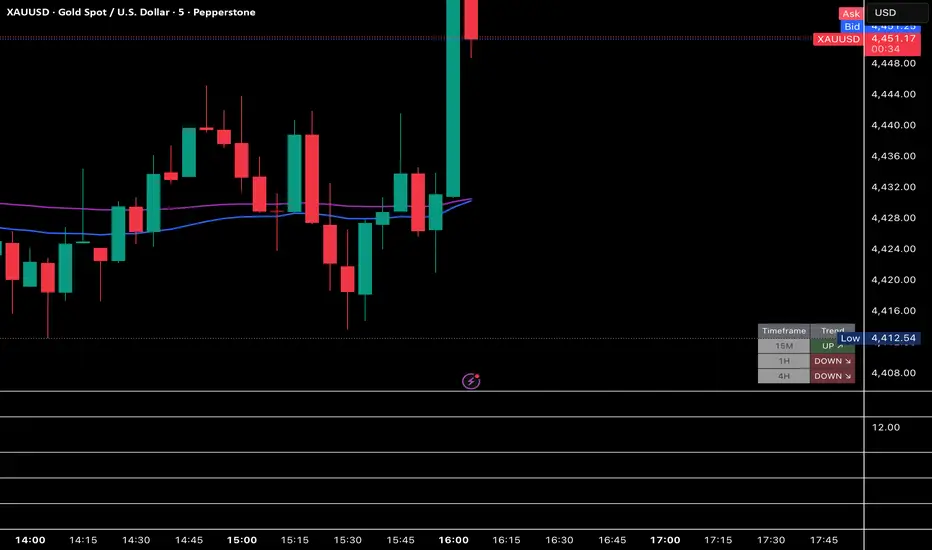
📊 Indicator Overview:
This is a Multi-Timeframe Trend Analyzer based on:
Short EMA (fast trend)
Long EMA (slow trend)
Across 3 customizable timeframes
It summarizes market direction into a simple table + chart overlay, so you instantly know the market bias.
🧠 Core Logic
The trend is defined using a very clear rule:
📌 Bullish (UP ↗)
Price > Short EMA
Price > Long EMA
📌 Bearish (DOWN ↘)
Price < Short EMA
Price < Long EMA
👉 So you’re basically measuring:
Is price above both momentum layers? → strong bullish
Below both? → strong bearish
⏱️ Multi-Timeframe Analysis
You can choose any 3 timeframes, for example:
15M (entry timing)
1H (intraday trend)
4H (macro bias)
Each timeframe is analyzed independently and displayed in the table.
📋 Trend Table
The indicator draws a table on your chart showing:
🔹 If EMA values are enabled:
| Timeframe | Trend | EMA Short | EMA Long |
🔹 If disabled:
| Timeframe | Trend |
🎯 Signal Meaning
🟢 UP ↗
Price is above both EMAs
Strong bullish bias
🔴 DOWN ↘
Price is below both EMAs
Strong bearish bias
📈 Current Timeframe EMAs
The indicator also plots on your chart:
Short EMA
Long EMA
⚙️ You can enable/disable this from inputs.
👉 This gives you visual confirmation directly on price.
⚙️ Inputs & Customization
🔹 Timeframes
1st TF
2nd TF
3rd TF
(fully customizable)
🔹 EMA Settings
Short EMA length
Long EMA length
🔹 Display Options
Show/hide EMA values in table
Show/hide EMAs on chart
Table position
💡 Practical Trading Use
1️⃣ Trend Filtering (Bias Tool)
All 3 TFs = UP → strong bullish environment
All 3 TFs = DOWN → strong bearish environment
👉 Use it to define market bias before entering
2️⃣ Entry Timing
Example:
4H → UP
1H → UP
15M → Pullback
👉 Look for buy entries on lower timeframe
3️⃣ Avoid Bad Trades
Example:
4H → UP
1H → DOWN
👉 Market is conflicting → stay out
⚠️ Important Notes
- This is not a standalone entry system
- It’s a trend/bias confirmation tool
- EMAs are lagging → signals are slightly delayed
🧩 Final Summary
This indicator simplifies a complex question:
“Is the market aligned across multiple timeframes?”
This is a Multi-Timeframe Trend Analyzer based on:
Short EMA (fast trend)
Long EMA (slow trend)
Across 3 customizable timeframes
It summarizes market direction into a simple table + chart overlay, so you instantly know the market bias.
🧠 Core Logic
The trend is defined using a very clear rule:
📌 Bullish (UP ↗)
Price > Short EMA
Price > Long EMA
📌 Bearish (DOWN ↘)
Price < Short EMA
Price < Long EMA
👉 So you’re basically measuring:
Is price above both momentum layers? → strong bullish
Below both? → strong bearish
⏱️ Multi-Timeframe Analysis
You can choose any 3 timeframes, for example:
15M (entry timing)
1H (intraday trend)
4H (macro bias)
Each timeframe is analyzed independently and displayed in the table.
📋 Trend Table
The indicator draws a table on your chart showing:
🔹 If EMA values are enabled:
| Timeframe | Trend | EMA Short | EMA Long |
🔹 If disabled:
| Timeframe | Trend |
🎯 Signal Meaning
🟢 UP ↗
Price is above both EMAs
Strong bullish bias
🔴 DOWN ↘
Price is below both EMAs
Strong bearish bias
📈 Current Timeframe EMAs
The indicator also plots on your chart:
Short EMA
Long EMA
⚙️ You can enable/disable this from inputs.
👉 This gives you visual confirmation directly on price.
⚙️ Inputs & Customization
🔹 Timeframes
1st TF
2nd TF
3rd TF
(fully customizable)
🔹 EMA Settings
Short EMA length
Long EMA length
🔹 Display Options
Show/hide EMA values in table
Show/hide EMAs on chart
Table position
💡 Practical Trading Use
1️⃣ Trend Filtering (Bias Tool)
All 3 TFs = UP → strong bullish environment
All 3 TFs = DOWN → strong bearish environment
👉 Use it to define market bias before entering
2️⃣ Entry Timing
Example:
4H → UP
1H → UP
15M → Pullback
👉 Look for buy entries on lower timeframe
3️⃣ Avoid Bad Trades
Example:
4H → UP
1H → DOWN
👉 Market is conflicting → stay out
⚠️ Important Notes
- This is not a standalone entry system
- It’s a trend/bias confirmation tool
- EMAs are lagging → signals are slightly delayed
🧩 Final Summary
This indicator simplifies a complex question:
“Is the market aligned across multiple timeframes?”
สคริปต์แบบโอเพนซอร์ส
ด้วยเจตนารมณ์หลักของ TradingView ผู้สร้างสคริปต์นี้ได้ทำให้เป็นโอเพนซอร์ส เพื่อให้เทรดเดอร์สามารถตรวจสอบและยืนยันฟังก์ชันการทำงานของมันได้ ขอชื่นชมผู้เขียน! แม้ว่าคุณจะใช้งานได้ฟรี แต่โปรดจำไว้ว่าการเผยแพร่โค้ดซ้ำจะต้องเป็นไปตาม กฎระเบียบการใช้งาน ของเรา

คำจำกัดสิทธิ์ความรับผิดชอบ
ข้อมูลและบทความไม่ได้มีวัตถุประสงค์เพื่อก่อให้เกิดกิจกรรมทางการเงิน, การลงทุน, การซื้อขาย, ข้อเสนอแนะ หรือคำแนะนำประเภทอื่น ๆ ที่ให้หรือรับรองโดย TradingView อ่านเพิ่มเติมใน ข้อกำหนดการใช้งาน
สคริปต์แบบโอเพนซอร์ส
ด้วยเจตนารมณ์หลักของ TradingView ผู้สร้างสคริปต์นี้ได้ทำให้เป็นโอเพนซอร์ส เพื่อให้เทรดเดอร์สามารถตรวจสอบและยืนยันฟังก์ชันการทำงานของมันได้ ขอชื่นชมผู้เขียน! แม้ว่าคุณจะใช้งานได้ฟรี แต่โปรดจำไว้ว่าการเผยแพร่โค้ดซ้ำจะต้องเป็นไปตาม กฎระเบียบการใช้งาน ของเรา
คำจำกัดสิทธิ์ความรับผิดชอบ
ข้อมูลและบทความไม่ได้มีวัตถุประสงค์เพื่อก่อให้เกิดกิจกรรมทางการเงิน, การลงทุน, การซื้อขาย, ข้อเสนอแนะ หรือคำแนะนำประเภทอื่น ๆ ที่ให้หรือรับรองโดย TradingView อ่านเพิ่มเติมใน ข้อกำหนดการใช้งาน