OPEN-SOURCE SCRIPT
MACD Pullback Validation with Divergence Filters [algo_aakash]
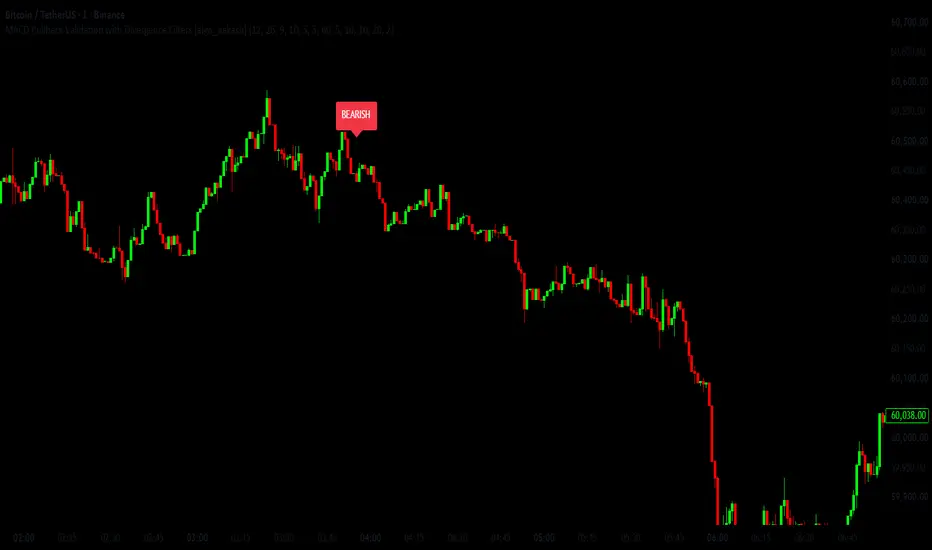
MACD Pullback Validation with Divergence Filters is a momentum confirmation indicator designed to identify continuation opportunities after temporary pullbacks rather than generating signals from every MACD crossover.
Instead of relying on a single event, the script evaluates multiple stages of market behavior. It begins by detecting pullbacks within an existing momentum cycle, waits for momentum recovery, confirms that price and the MACD histogram are no longer weakening, and optionally verifies that the setup occurs near significant price locations using pivot-derived support/resistance levels or Bollinger Band extremes.
The objective is to reduce low-quality MACD signals by requiring several independent conditions to align before a bullish or bearish signal is displayed.
Problem Statement
Traditional MACD crossover signals frequently occur during ranging markets or immediately after short-lived momentum fluctuations. Likewise, divergence signals alone often appear too early and do not necessarily indicate that momentum has already shifted back in the anticipated direction.
This indicator addresses that limitation by requiring multiple confirmation stages rather than treating each condition as an independent trading signal.
Instead of responding to isolated events, it evaluates whether a pullback has occurred, whether momentum is rebuilding, whether a recent divergence supports the move, and whether price is located in an area where reversals may be more meaningful.
Methodology
The analytical framework consists of several sequential validation layers.
First, MACD crossover events occurring above or below the zero line are monitored to identify temporary pullbacks within an existing momentum cycle. These crossover events establish the recent pullback state.
Next, the script monitors the MACD histogram. Bullish momentum requires the histogram to remain above zero while increasing relative to the previous bar. Bearish momentum requires the histogram to remain below zero while decreasing.
The indicator then waits for the MACD line itself to cross the zero line, treating this as evidence that momentum has shifted back in the direction of the prevailing move.
Histogram divergence is calculated using confirmed pivot highs and pivot lows. Regular bullish divergence requires price to form a lower low while the histogram forms a higher low. Regular bearish divergence requires price to form a higher high while the histogram forms a lower high. Hidden divergence calculations are also available for users who wish to visualize continuation-type divergence.
Finally, optional contextual filters may be enabled.
The Support/Resistance filter checks whether the current price is interacting with recently confirmed pivot-based levels.
The Bollinger Band filter requires bullish setups to occur after closing below the lower band and bearish setups after closing above the upper band, helping identify momentum reversals from statistically extended price conditions.
Signals are generated only after every enabled validation layer has been satisfied.
Signal Workflow
Bullish workflow
1. Detect a recent bearish MACD crossover occurring above the zero line to identify a pullback.
2. Confirm a regular bullish MACD histogram divergence using pivot comparisons.
3. Require the MACD histogram to begin strengthening.
4. Wait for the MACD line to cross back above the zero line.
5. Optionally require interaction with recent pivot-based support.
6. Optionally require price to close below the lower Bollinger Band.
7. Display a bullish signal.
Bearish workflow
1. Detect a recent bullish MACD crossover occurring below the zero line.
2. Confirm a regular bearish MACD histogram divergence.
3. Require bearish histogram acceleration.
4. Wait for the MACD line to cross below the zero line.
5. Optionally require interaction with recent pivot-based resistance.
6. Optionally require price to close above the upper Bollinger Band.
7. Display a bearish signal.
Why This Indicator Is Different
Many MACD indicators generate signals immediately after crossovers, while divergence indicators typically evaluate price and momentum independently.
This script integrates these concepts into a sequential validation framework where each condition serves a different analytical purpose.
The pullback logic identifies temporary counter-trend momentum.
The histogram evaluates whether momentum is rebuilding.
The zero-line crossover confirms broader momentum alignment.
Divergence provides evidence that momentum and price are no longer moving in agreement.
Optional pivot interaction and Bollinger Band filters add market-location confirmation before a signal is produced.
Rather than displaying every crossover or every divergence, the indicator waits until multiple independent conditions align before producing a trading signal.
Inputs
The script includes configurable parameters for:
* MACD fast, slow, and signal periods
* Pullback lookback window
* Divergence pivot lengths
* Divergence range settings
* Optional hidden divergence display
* Optional Support/Resistance validation
* Pivot sensitivity
* Optional Bollinger Band confirmation
* Bollinger Band length and standard deviation
Alerts
Built-in alert conditions are available for:
* Bullish Signal
* Bearish Signal
* Regular Bullish Divergence
* Hidden Bullish Divergence
* Regular Bearish Divergence
* Hidden Bearish Divergence
Practical Usage
The indicator is intended for traders who prefer waiting for momentum confirmation after temporary pullbacks instead of reacting to every MACD crossover.
Optional Support/Resistance and Bollinger Band filters can be enabled to make signal selection more restrictive when additional price-location confirmation is desired.
Limitations
MACD histogram divergence relies on confirmed pivot highs and lows, so divergence signals are only confirmed after the required pivot bars have formed.
Support and resistance levels are derived from pivot calculations and represent algorithmically identified swing points rather than manually drawn market structure.
Like any momentum-based indicator, performance may vary across different market conditions and should be evaluated alongside a broader trading plan and appropriate risk management.
Notes
This indicator is intended as an analytical decision-support tool. It combines momentum analysis, pullback recognition, divergence detection, and optional contextual filters into a structured confirmation process rather than relying on any individual condition as a standalone trading signal.
Instead of relying on a single event, the script evaluates multiple stages of market behavior. It begins by detecting pullbacks within an existing momentum cycle, waits for momentum recovery, confirms that price and the MACD histogram are no longer weakening, and optionally verifies that the setup occurs near significant price locations using pivot-derived support/resistance levels or Bollinger Band extremes.
The objective is to reduce low-quality MACD signals by requiring several independent conditions to align before a bullish or bearish signal is displayed.
Problem Statement
Traditional MACD crossover signals frequently occur during ranging markets or immediately after short-lived momentum fluctuations. Likewise, divergence signals alone often appear too early and do not necessarily indicate that momentum has already shifted back in the anticipated direction.
This indicator addresses that limitation by requiring multiple confirmation stages rather than treating each condition as an independent trading signal.
Instead of responding to isolated events, it evaluates whether a pullback has occurred, whether momentum is rebuilding, whether a recent divergence supports the move, and whether price is located in an area where reversals may be more meaningful.
Methodology
The analytical framework consists of several sequential validation layers.
First, MACD crossover events occurring above or below the zero line are monitored to identify temporary pullbacks within an existing momentum cycle. These crossover events establish the recent pullback state.
Next, the script monitors the MACD histogram. Bullish momentum requires the histogram to remain above zero while increasing relative to the previous bar. Bearish momentum requires the histogram to remain below zero while decreasing.
The indicator then waits for the MACD line itself to cross the zero line, treating this as evidence that momentum has shifted back in the direction of the prevailing move.
Histogram divergence is calculated using confirmed pivot highs and pivot lows. Regular bullish divergence requires price to form a lower low while the histogram forms a higher low. Regular bearish divergence requires price to form a higher high while the histogram forms a lower high. Hidden divergence calculations are also available for users who wish to visualize continuation-type divergence.
Finally, optional contextual filters may be enabled.
The Support/Resistance filter checks whether the current price is interacting with recently confirmed pivot-based levels.
The Bollinger Band filter requires bullish setups to occur after closing below the lower band and bearish setups after closing above the upper band, helping identify momentum reversals from statistically extended price conditions.
Signals are generated only after every enabled validation layer has been satisfied.
Signal Workflow
Bullish workflow
1. Detect a recent bearish MACD crossover occurring above the zero line to identify a pullback.
2. Confirm a regular bullish MACD histogram divergence using pivot comparisons.
3. Require the MACD histogram to begin strengthening.
4. Wait for the MACD line to cross back above the zero line.
5. Optionally require interaction with recent pivot-based support.
6. Optionally require price to close below the lower Bollinger Band.
7. Display a bullish signal.
Bearish workflow
1. Detect a recent bullish MACD crossover occurring below the zero line.
2. Confirm a regular bearish MACD histogram divergence.
3. Require bearish histogram acceleration.
4. Wait for the MACD line to cross below the zero line.
5. Optionally require interaction with recent pivot-based resistance.
6. Optionally require price to close above the upper Bollinger Band.
7. Display a bearish signal.
Why This Indicator Is Different
Many MACD indicators generate signals immediately after crossovers, while divergence indicators typically evaluate price and momentum independently.
This script integrates these concepts into a sequential validation framework where each condition serves a different analytical purpose.
The pullback logic identifies temporary counter-trend momentum.
The histogram evaluates whether momentum is rebuilding.
The zero-line crossover confirms broader momentum alignment.
Divergence provides evidence that momentum and price are no longer moving in agreement.
Optional pivot interaction and Bollinger Band filters add market-location confirmation before a signal is produced.
Rather than displaying every crossover or every divergence, the indicator waits until multiple independent conditions align before producing a trading signal.
Inputs
The script includes configurable parameters for:
* MACD fast, slow, and signal periods
* Pullback lookback window
* Divergence pivot lengths
* Divergence range settings
* Optional hidden divergence display
* Optional Support/Resistance validation
* Pivot sensitivity
* Optional Bollinger Band confirmation
* Bollinger Band length and standard deviation
Alerts
Built-in alert conditions are available for:
* Bullish Signal
* Bearish Signal
* Regular Bullish Divergence
* Hidden Bullish Divergence
* Regular Bearish Divergence
* Hidden Bearish Divergence
Practical Usage
The indicator is intended for traders who prefer waiting for momentum confirmation after temporary pullbacks instead of reacting to every MACD crossover.
Optional Support/Resistance and Bollinger Band filters can be enabled to make signal selection more restrictive when additional price-location confirmation is desired.
Limitations
MACD histogram divergence relies on confirmed pivot highs and lows, so divergence signals are only confirmed after the required pivot bars have formed.
Support and resistance levels are derived from pivot calculations and represent algorithmically identified swing points rather than manually drawn market structure.
Like any momentum-based indicator, performance may vary across different market conditions and should be evaluated alongside a broader trading plan and appropriate risk management.
Notes
This indicator is intended as an analytical decision-support tool. It combines momentum analysis, pullback recognition, divergence detection, and optional contextual filters into a structured confirmation process rather than relying on any individual condition as a standalone trading signal.
สคริปต์โอเพนซอร์ซ
ด้วยเจตนารมณ์หลักของ TradingView ผู้สร้างสคริปต์นี้ได้ทำให้เป็นโอเพนซอร์ส เพื่อให้เทรดเดอร์สามารถตรวจสอบและยืนยันฟังก์ชันการทำงานของมันได้ ขอชื่นชมผู้เขียน! แม้ว่าคุณจะใช้งานได้ฟรี แต่โปรดจำไว้ว่าการเผยแพร่โค้ดซ้ำจะต้องเป็นไปตาม กฎระเบียบการใช้งาน ของเรา

Build your trading tools with AI : algotim.com
All content provided by AlgoTim (algo_aakash) is for informational and educational purposes only. Trading involves risk, and past performance does not guarantee future results.
All content provided by AlgoTim (algo_aakash) is for informational and educational purposes only. Trading involves risk, and past performance does not guarantee future results.
คำจำกัดสิทธิ์ความรับผิดชอบ
ข้อมูลและบทความไม่ได้มีวัตถุประสงค์เพื่อก่อให้เกิดกิจกรรมทางการเงิน, การลงทุน, การซื้อขาย, ข้อเสนอแนะ หรือคำแนะนำประเภทอื่น ๆ ที่ให้หรือรับรองโดย TradingView อ่านเพิ่มเติมใน ข้อกำหนดการใช้งาน
สคริปต์โอเพนซอร์ซ
ด้วยเจตนารมณ์หลักของ TradingView ผู้สร้างสคริปต์นี้ได้ทำให้เป็นโอเพนซอร์ส เพื่อให้เทรดเดอร์สามารถตรวจสอบและยืนยันฟังก์ชันการทำงานของมันได้ ขอชื่นชมผู้เขียน! แม้ว่าคุณจะใช้งานได้ฟรี แต่โปรดจำไว้ว่าการเผยแพร่โค้ดซ้ำจะต้องเป็นไปตาม กฎระเบียบการใช้งาน ของเรา
Build your trading tools with AI : algotim.com
All content provided by AlgoTim (algo_aakash) is for informational and educational purposes only. Trading involves risk, and past performance does not guarantee future results.
All content provided by AlgoTim (algo_aakash) is for informational and educational purposes only. Trading involves risk, and past performance does not guarantee future results.
คำจำกัดสิทธิ์ความรับผิดชอบ
ข้อมูลและบทความไม่ได้มีวัตถุประสงค์เพื่อก่อให้เกิดกิจกรรมทางการเงิน, การลงทุน, การซื้อขาย, ข้อเสนอแนะ หรือคำแนะนำประเภทอื่น ๆ ที่ให้หรือรับรองโดย TradingView อ่านเพิ่มเติมใน ข้อกำหนดการใช้งาน