Artillery Raid Model
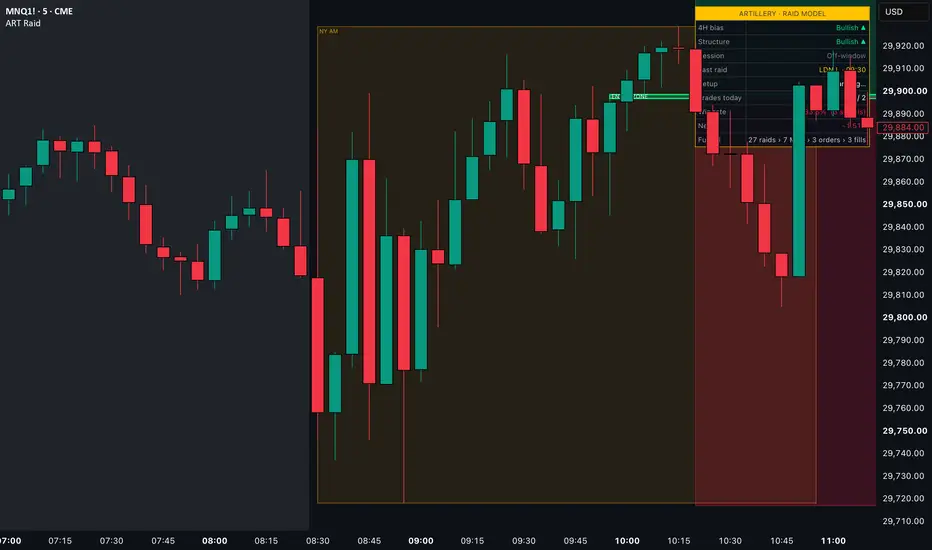
Artillery · Raid Model is an intraday liquidity tool for index futures (ES, NQ, MNQ) on 1–5 minute charts. It maps where resting liquidity sits, detects when that liquidity is raided during the New York morning, and only signals a trade after price confirms the reversal with a market-structure shift and a fair-value-gap retrace.
WHAT IT DRAWS
• Session ranges: Asia, London and NY AM boxes that build live as each session forms.
• Liquidity pools: Asia/London highs and lows, previous day high/low, previous week high/low, midnight open, and equal highs/lows (two swing points within a small ATR tolerance).
• Pool status: when price trades through a pool and closes back inside within N bars, the label flips to "RAIDED". If price closes through and stays there, it is marked "TAKEN" (a breakout, not a raid).
• Structure: BOS and CHoCH lines from confirmed pivots, plus a bold MSS line for the shift that follows a raid.
• Fair value gaps: three-candle imbalances shown as boxes that disappear once filled. The gap used by a setup is highlighted as ENTRY ZONE.
• Signals: BUY / SELL tags when the simulated limit order fills, target and stop boxes, and the result in R when the signal closes.
• Dashboard: 4H bias, current structure, active session, last raid, setup status, signals today, win rate, net R and a setup funnel (raids → MSS → orders → fills).
HOW A SIGNAL FORMS
1. During the NY AM window, a liquidity pool is raided (traded through, then reclaimed).
2. Within the next bars, a displacement candle (body ≥ a multiple of ATR) closes beyond the high/low of the leg that made the raid. This is the MSS.
3. A fair value gap that formed after the raid becomes the entry zone. A limit is placed at the gap's edge or 50% (consequent encroachment).
4. Stop goes beyond the raid extreme plus a tick buffer. Target is the nearest untouched opposite liquidity pool that offers at least the minimum R, otherwise a fixed R.
5. Unfilled orders cancel after N bars, if price invalidates the stop, or when the window closes. Open signals close at the end-of-day flatten time.
WHAT MAKES IT DIFFERENT
Most smart-money tools label every BOS and FVG on the chart. This script runs an ordered state machine: a setup can only arm after a raid, can only trigger after a displacement MSS, and only uses a gap formed after the raid. Raids are separated from breakouts with a reclaim window, and targets come from the same liquidity map that produced the raid. The built-in signal tracker scores every signal with the same rules (if stop and target are hit on the same bar it counts as a loss) so the dashboard numbers stay conservative.
HOW TO USE IT
• Apply to ES, NQ or MNQ on a 1m–5m chart. All session times are New York time and can be changed in the inputs.
• Tune "Raid must reclaim within N bars", "MSS displacement" and "Min R" to match your instrument and risk.
• Optional 4H EMA bias filter only allows signals in the direction of the higher-timeframe trend.
• Alerts are built in for raids, limit placements, fills and exits. Create an alert and choose "Any alert() function call".
NOTES
• Calculations use confirmed pivots and higher-timeframe data offset by one bar, so drawings do not repaint after the bar closes.
• The signal tracker is a simplified simulation without commissions or slippage. It is a study tool, not a backtest or a guarantee of future results.
• This script is for education and analysis only and is not financial advice. Always manage your own risk.
WHAT IT DRAWS
• Session ranges: Asia, London and NY AM boxes that build live as each session forms.
• Liquidity pools: Asia/London highs and lows, previous day high/low, previous week high/low, midnight open, and equal highs/lows (two swing points within a small ATR tolerance).
• Pool status: when price trades through a pool and closes back inside within N bars, the label flips to "RAIDED". If price closes through and stays there, it is marked "TAKEN" (a breakout, not a raid).
• Structure: BOS and CHoCH lines from confirmed pivots, plus a bold MSS line for the shift that follows a raid.
• Fair value gaps: three-candle imbalances shown as boxes that disappear once filled. The gap used by a setup is highlighted as ENTRY ZONE.
• Signals: BUY / SELL tags when the simulated limit order fills, target and stop boxes, and the result in R when the signal closes.
• Dashboard: 4H bias, current structure, active session, last raid, setup status, signals today, win rate, net R and a setup funnel (raids → MSS → orders → fills).
HOW A SIGNAL FORMS
1. During the NY AM window, a liquidity pool is raided (traded through, then reclaimed).
2. Within the next bars, a displacement candle (body ≥ a multiple of ATR) closes beyond the high/low of the leg that made the raid. This is the MSS.
3. A fair value gap that formed after the raid becomes the entry zone. A limit is placed at the gap's edge or 50% (consequent encroachment).
4. Stop goes beyond the raid extreme plus a tick buffer. Target is the nearest untouched opposite liquidity pool that offers at least the minimum R, otherwise a fixed R.
5. Unfilled orders cancel after N bars, if price invalidates the stop, or when the window closes. Open signals close at the end-of-day flatten time.
WHAT MAKES IT DIFFERENT
Most smart-money tools label every BOS and FVG on the chart. This script runs an ordered state machine: a setup can only arm after a raid, can only trigger after a displacement MSS, and only uses a gap formed after the raid. Raids are separated from breakouts with a reclaim window, and targets come from the same liquidity map that produced the raid. The built-in signal tracker scores every signal with the same rules (if stop and target are hit on the same bar it counts as a loss) so the dashboard numbers stay conservative.
HOW TO USE IT
• Apply to ES, NQ or MNQ on a 1m–5m chart. All session times are New York time and can be changed in the inputs.
• Tune "Raid must reclaim within N bars", "MSS displacement" and "Min R" to match your instrument and risk.
• Optional 4H EMA bias filter only allows signals in the direction of the higher-timeframe trend.
• Alerts are built in for raids, limit placements, fills and exits. Create an alert and choose "Any alert() function call".
NOTES
• Calculations use confirmed pivots and higher-timeframe data offset by one bar, so drawings do not repaint after the bar closes.
• The signal tracker is a simplified simulation without commissions or slippage. It is a study tool, not a backtest or a guarantee of future results.
• This script is for education and analysis only and is not financial advice. Always manage your own risk.

คำจำกัดสิทธิ์ความรับผิดชอบ
ข้อมูลและบทความไม่ได้มีวัตถุประสงค์เพื่อก่อให้เกิดกิจกรรมทางการเงิน, การลงทุน, การซื้อขาย, ข้อเสนอแนะ หรือคำแนะนำประเภทอื่น ๆ ที่ให้หรือรับรองโดย TradingView อ่านเพิ่มเติมใน ข้อกำหนดการใช้งาน
คำจำกัดสิทธิ์ความรับผิดชอบ
ข้อมูลและบทความไม่ได้มีวัตถุประสงค์เพื่อก่อให้เกิดกิจกรรมทางการเงิน, การลงทุน, การซื้อขาย, ข้อเสนอแนะ หรือคำแนะนำประเภทอื่น ๆ ที่ให้หรือรับรองโดย TradingView อ่านเพิ่มเติมใน ข้อกำหนดการใช้งาน