Currency Strength Meter - Closed Bar
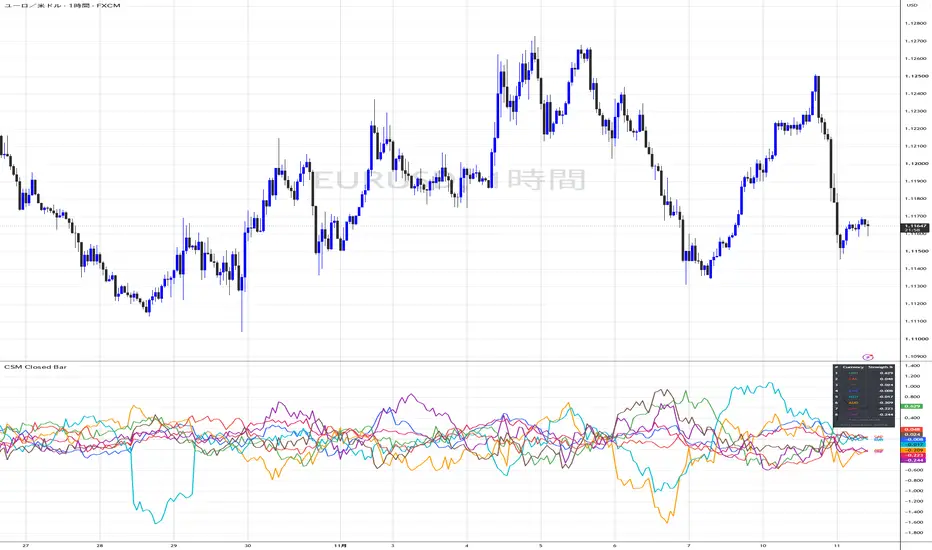
This indicator shows the relative strength of the 8 major currencies (EUR, GBP, AUD, NZD, USD, CAD, CHF, JPY) in a separate pane, calculated from all 28 pairs between them. The formula is fully open in the source code.
HOW IT IS CALCULATED
1. For each of the 28 pairs, the percent change over the last N closed bars of the chart timeframe is taken:
change = (close[1] - close[1 + N]) / close[1 + N] x 100
2. The strength of a currency is the average of the changes of the pairs that contain it. The change is added as is when the currency is the base currency and with the opposite sign when it is the quote currency.
Example: EUR strength = average of EURUSD, EURGBP, EURAUD, EURNZD, EURCAD, EURCHF, EURJPY changes.
USD strength = average of (-EURUSD, -GBPUSD, -AUDUSD, -NZDUSD, USDCAD, USDCHF, USDJPY).
3. When all 28 pairs are available the 8 values add up to zero, so the lines show which currency gained or lost against the others over the same period.
WHAT IS DIFFERENT IN THIS VERSION
- Closed bars only: every pair is read from its last closed bar, so the history does not repaint and looks the same after a reload.
- Data coverage is shown: the table tells you how many of the 28 pairs actually returned data, so a missing pair is never hidden inside the average.
- Selectable data source: you choose which exchange feed is used for all 28 pairs, so the values are consistent with the feed you trade or study.
- The whole formula is written in this description and in the code, with no hidden weighting or smoothing.
WHAT YOU SEE
- 8 lines, one per currency, with the currency name at the right end.
- A small ranking table (rank, currency, value) for the last bar, with the number of pairs that had data ("Pairs used n/28").
INPUTS
- Data source: the exchange prefix used for the 28 pairs (default OANDA, which lists all 28). Pairs with no data on the selected source are skipped and the table shows how many were used.
- Lookback: N closed bars (default 20).
- Display: names, table, table position, line width, colors.
REPAINTING
Only closed bars are used: every pair is requested with close[1] and lookahead on, which is the documented non-repainting pattern. Values on past bars do not change after the bar closes and are the same after a reload. Because of this, the line on the current bar shows the value as of the previous closed bar.
On the bar that is still forming, the value can move slightly for a short time until the new bar of every pair has arrived. Once a bar has closed, its value does not change.
NOTES AND LIMITATIONS
- The calculation runs on the chart timeframe only.
- The values come from the 28 currency pairs, not from the chart symbol. On symbols that trade when the currency market is closed (for example crypto on weekends), the lines stay flat during those hours.
- Different data sources can give slightly different values.
- The script makes 28 data requests, so it may take a few seconds to load.
This script is a display tool for studying relative currency movement. It does not give buy or sell signals and does not predict future prices. Past behaviour of currency strength does not guarantee future results.
HOW IT IS CALCULATED
1. For each of the 28 pairs, the percent change over the last N closed bars of the chart timeframe is taken:
change = (close[1] - close[1 + N]) / close[1 + N] x 100
2. The strength of a currency is the average of the changes of the pairs that contain it. The change is added as is when the currency is the base currency and with the opposite sign when it is the quote currency.
Example: EUR strength = average of EURUSD, EURGBP, EURAUD, EURNZD, EURCAD, EURCHF, EURJPY changes.
USD strength = average of (-EURUSD, -GBPUSD, -AUDUSD, -NZDUSD, USDCAD, USDCHF, USDJPY).
3. When all 28 pairs are available the 8 values add up to zero, so the lines show which currency gained or lost against the others over the same period.
WHAT IS DIFFERENT IN THIS VERSION
- Closed bars only: every pair is read from its last closed bar, so the history does not repaint and looks the same after a reload.
- Data coverage is shown: the table tells you how many of the 28 pairs actually returned data, so a missing pair is never hidden inside the average.
- Selectable data source: you choose which exchange feed is used for all 28 pairs, so the values are consistent with the feed you trade or study.
- The whole formula is written in this description and in the code, with no hidden weighting or smoothing.
WHAT YOU SEE
- 8 lines, one per currency, with the currency name at the right end.
- A small ranking table (rank, currency, value) for the last bar, with the number of pairs that had data ("Pairs used n/28").
INPUTS
- Data source: the exchange prefix used for the 28 pairs (default OANDA, which lists all 28). Pairs with no data on the selected source are skipped and the table shows how many were used.
- Lookback: N closed bars (default 20).
- Display: names, table, table position, line width, colors.
REPAINTING
Only closed bars are used: every pair is requested with close[1] and lookahead on, which is the documented non-repainting pattern. Values on past bars do not change after the bar closes and are the same after a reload. Because of this, the line on the current bar shows the value as of the previous closed bar.
On the bar that is still forming, the value can move slightly for a short time until the new bar of every pair has arrived. Once a bar has closed, its value does not change.
NOTES AND LIMITATIONS
- The calculation runs on the chart timeframe only.
- The values come from the 28 currency pairs, not from the chart symbol. On symbols that trade when the currency market is closed (for example crypto on weekends), the lines stay flat during those hours.
- Different data sources can give slightly different values.
- The script makes 28 data requests, so it may take a few seconds to load.
This script is a display tool for studying relative currency movement. It does not give buy or sell signals and does not predict future prices. Past behaviour of currency strength does not guarantee future results.

K'u Hero - indie developer of Pine Script and MT5/MT4 indicators. Posts are educational, not financial advice and not buy/sell signals. Tool guides: youtube.com/@KuHero-tools
คำจำกัดสิทธิ์ความรับผิดชอบ
ข้อมูลและบทความไม่ได้มีวัตถุประสงค์เพื่อก่อให้เกิดกิจกรรมทางการเงิน, การลงทุน, การซื้อขาย, ข้อเสนอแนะ หรือคำแนะนำประเภทอื่น ๆ ที่ให้หรือรับรองโดย TradingView อ่านเพิ่มเติมใน ข้อกำหนดการใช้งาน
K'u Hero - indie developer of Pine Script and MT5/MT4 indicators. Posts are educational, not financial advice and not buy/sell signals. Tool guides: youtube.com/@KuHero-tools
คำจำกัดสิทธิ์ความรับผิดชอบ
ข้อมูลและบทความไม่ได้มีวัตถุประสงค์เพื่อก่อให้เกิดกิจกรรมทางการเงิน, การลงทุน, การซื้อขาย, ข้อเสนอแนะ หรือคำแนะนำประเภทอื่น ๆ ที่ให้หรือรับรองโดย TradingView อ่านเพิ่มเติมใน ข้อกำหนดการใช้งาน