Premium Discount Matrix [BOSWaves]
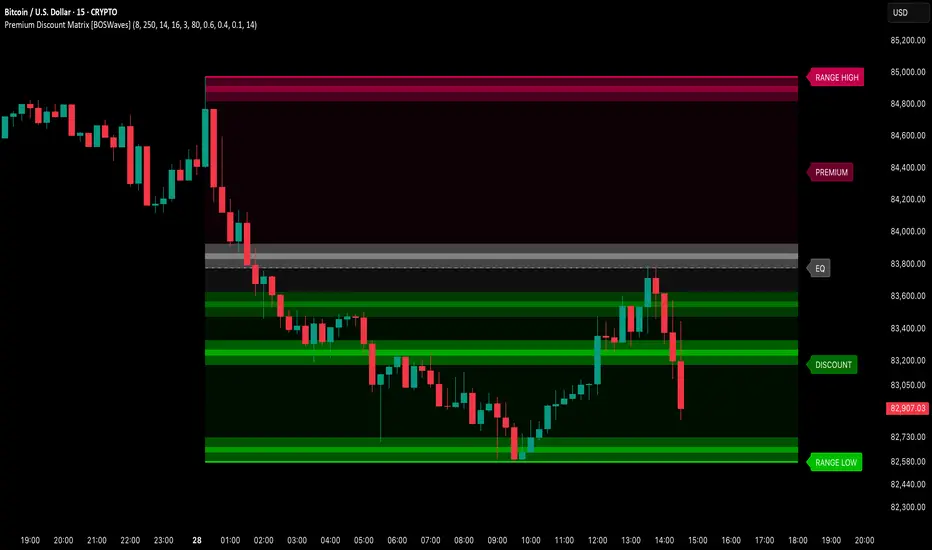
Premium Discount Matrix [BOSWaves] - Swing-Anchored Dealing Range with Internal Structure Scoring and Premium, Equilibrium, and Discount Zone Mapping
Overview
Premium Discount Matrix [BOSWaves] is a swing-anchored dealing range system that divides the active range between the most recent confirmed swing high and swing low into a configurable grid of horizontal price rows, classifies each row as premium, equilibrium, or discount relative to the range midpoint, and scores every row by the density and rejection quality of the internal pivots that have formed within it.

Instead of simply splitting a range into two static halves, each row of the matrix is weighted by how much real structural activity has occurred at that price level. Internal pivots are detected continuously at a finer scale than the dealing range swings, each one assigned a quality score from its wick rejection and its ATR-normalized distance from the closing price at confirmation. Pivots that fall inside the active range are then mapped to the rows they occupy, and each row's opacity and core band intensity scale with the combined pivot density and average rejection quality at that level. Rows where price has repeatedly turned with strong rejection render brighter and more defined, while rows that price has passed through without reaction remain faint.
This creates a premium and discount framework that goes beyond location alone. The range edges define the dealing range boundaries, the equilibrium band marks the fair value midpoint, and the matrix intensity identifies exactly where within each zone the market has shown meaningful structural interest. The result is a single overlay that communicates both where price sits within the current range and which levels inside that range have historically carried reaction significance.
Price is therefore evaluated not just for whether it is trading at a premium or a discount, but for whether it is trading at a premium or discount level that the internal structure of the range has already validated.
Conceptual Framework
Premium Discount Matrix is founded on the principle that premium and discount analysis should do more than label the upper and lower halves of a range. It should identify which specific price levels inside each half have demonstrated structural relevance through repeated pivot formation and measurable rejection behavior.
Traditional premium and discount tools draw a range, mark the 50% level, and treat every price above equilibrium as equally expensive and every price below as equally cheap. In practice, reactions cluster at specific levels within a range, and those levels are rarely distributed evenly. This framework closes that gap by dividing the range into discrete rows and scoring each row from the internal pivots that have formed inside it, so that location context and structural context are presented together rather than requiring separate analysis.
Three core principles guide the design:
This shifts premium and discount analysis from a binary location reading into a structure-weighted map of the dealing range where every level carries both a zone classification and an evidence-based intensity score.
Theoretical Foundation
The indicator combines pivot-based swing detection for dealing range construction, midpoint equilibrium calculation with a configurable neutral band, internal pivot detection at a shorter confirmation length, wick-based and ATR-normalized rejection scoring for pivot quality, row-based price partitioning of the active range, and a weighted structure score that blends pivot density with average rejection quality to drive row intensity.
The dealing range high and low are taken from the most recently confirmed swing high and swing low, each requiring the configured number of bars on both sides for confirmation. Equilibrium is the arithmetic midpoint of the range, surrounded by a neutral band sized as a percentage of the total range. Internal pivots are detected at a shorter confirmation length and scored on two components: the wick score, which measures the rejection wick relative to the full candle range, and the rejection score, which measures how far price has moved away from the pivot by the time it confirms, normalized by ATR. These combine into a single 0-1 quality score, weighted 55% toward wick rejection and 45% toward follow-through distance.
Four internal systems operate in tandem:
This design ensures the dealing range boundaries, zone classification, and internal structure weighting all update together from a single consistent structural reference.
How It Works
Premium Discount Matrix evaluates price through a sequence of range construction and structure scoring processes:
Together, these elements form a continuously updating dealing range map that combines zone location with evidence-weighted structural intensity at every level.
Interpretation
Premium Discount Matrix should be interpreted as a structure-weighted location framework for the current dealing range:
Zone color, row intensity, and core band definition collectively communicate more location and structural context than a simple premium and discount split in isolation.
Signal Logic & Visual Cues
Premium Discount Matrix is a contextual framework rather than a directional signal generator. It presents two primary structural events that redefine the dealing range:
Row intensity and core band brightness provide continuous secondary context throughout the life of each range, with high-scoring rows identifying the levels most likely to carry reaction significance as price revisits them.
Alert generation covers new range high and new range low confirmation events for systematic monitoring workflows.
Strategy Integration
Premium Discount Matrix fits within dealing range, premium and discount, and structure-based reaction approaches:
Technical Implementation Details
Optimal Application Parameters
Timeframe Guidance:
Suggested Baseline Configuration:
These suggested parameters should be used as a baseline; their effectiveness depends on the instrument's volatility characteristics, swing structure frequency, and preferred range sensitivity, so fine-tuning is expected for optimal performance.
Parameter Calibration Notes
Use the following adjustments to refine behavior without altering the core logic:
Adjustments should be incremental and evaluated across multiple session types rather than isolated market conditions.
Performance Characteristics
High Effectiveness:
Reduced Effectiveness:
Integration Guidelines
Disclaimer
Premium Discount Matrix [BOSWaves] is a professional-grade dealing range visualization and internal structure scoring tool. It uses swing-anchored range construction with pivot density and rejection-based level weighting but does not predict future price movements. Results depend on market conditions, instrument swing characteristics, parameter selection, and disciplined execution. BOSWaves recommends deploying this indicator within a broader analytical framework that incorporates order flow context, structural analysis, and comprehensive risk management.
Overview
Premium Discount Matrix [BOSWaves] is a swing-anchored dealing range system that divides the active range between the most recent confirmed swing high and swing low into a configurable grid of horizontal price rows, classifies each row as premium, equilibrium, or discount relative to the range midpoint, and scores every row by the density and rejection quality of the internal pivots that have formed within it.
Instead of simply splitting a range into two static halves, each row of the matrix is weighted by how much real structural activity has occurred at that price level. Internal pivots are detected continuously at a finer scale than the dealing range swings, each one assigned a quality score from its wick rejection and its ATR-normalized distance from the closing price at confirmation. Pivots that fall inside the active range are then mapped to the rows they occupy, and each row's opacity and core band intensity scale with the combined pivot density and average rejection quality at that level. Rows where price has repeatedly turned with strong rejection render brighter and more defined, while rows that price has passed through without reaction remain faint.
This creates a premium and discount framework that goes beyond location alone. The range edges define the dealing range boundaries, the equilibrium band marks the fair value midpoint, and the matrix intensity identifies exactly where within each zone the market has shown meaningful structural interest. The result is a single overlay that communicates both where price sits within the current range and which levels inside that range have historically carried reaction significance.
Price is therefore evaluated not just for whether it is trading at a premium or a discount, but for whether it is trading at a premium or discount level that the internal structure of the range has already validated.
Conceptual Framework
Premium Discount Matrix is founded on the principle that premium and discount analysis should do more than label the upper and lower halves of a range. It should identify which specific price levels inside each half have demonstrated structural relevance through repeated pivot formation and measurable rejection behavior.
Traditional premium and discount tools draw a range, mark the 50% level, and treat every price above equilibrium as equally expensive and every price below as equally cheap. In practice, reactions cluster at specific levels within a range, and those levels are rarely distributed evenly. This framework closes that gap by dividing the range into discrete rows and scoring each row from the internal pivots that have formed inside it, so that location context and structural context are presented together rather than requiring separate analysis.
Three core principles guide the design:
- The dealing range should be anchored to confirmed swing structure rather than arbitrary lookback windows, ensuring the premium, equilibrium, and discount zones reflect the boundaries the market itself has established.
- Each level within the range should be weighted by measurable structural evidence, combining how often price has pivoted at that level with how decisively it rejected, so that visual emphasis reflects actual market behavior rather than equal treatment of all prices.
- Zone classification and structural intensity should be communicated through a single continuous visual layer, where color identifies the zone and opacity identifies the strength of structure within it, removing the need to cross-reference separate tools.
This shifts premium and discount analysis from a binary location reading into a structure-weighted map of the dealing range where every level carries both a zone classification and an evidence-based intensity score.
Theoretical Foundation
The indicator combines pivot-based swing detection for dealing range construction, midpoint equilibrium calculation with a configurable neutral band, internal pivot detection at a shorter confirmation length, wick-based and ATR-normalized rejection scoring for pivot quality, row-based price partitioning of the active range, and a weighted structure score that blends pivot density with average rejection quality to drive row intensity.
The dealing range high and low are taken from the most recently confirmed swing high and swing low, each requiring the configured number of bars on both sides for confirmation. Equilibrium is the arithmetic midpoint of the range, surrounded by a neutral band sized as a percentage of the total range. Internal pivots are detected at a shorter confirmation length and scored on two components: the wick score, which measures the rejection wick relative to the full candle range, and the rejection score, which measures how far price has moved away from the pivot by the time it confirms, normalized by ATR. These combine into a single 0-1 quality score, weighted 55% toward wick rejection and 45% toward follow-through distance.
Four internal systems operate in tandem:
- Dealing Range Engine: Detects swing highs and lows using the configured swing length, replaces the range high or range low with each newly confirmed swing on the corresponding side, calculates the range size and equilibrium midpoint, and determines the range start bar from the earlier of the two anchoring swings, clamped by the maximum range history.
- Internal Structure Engine: Detects internal pivot highs and lows at the shorter internal pivot length, scores each pivot from wick proportion and ATR-normalized rejection distance, and stores price, quality, and bar location in a rolling memory that discards the oldest pivots once the configured capacity is reached.
- Matrix Scoring System: Divides the active range into the configured number of rows, counts the stored internal pivots that fall within each row and formed on or after the range start, computes a density score saturating at four pivots and an average rejection score, and blends them using the configured density and rejection weights into a single structure score per row.
- Zone Rendering System: Classifies each row as premium, equilibrium, or discount from its midpoint relative to the equilibrium band, maps structure score to row transparency and to a concentrated core band through the center of each row, and renders the range high, range low, dashed equilibrium line, and zone labels projected forward from the current bar.
This design ensures the dealing range boundaries, zone classification, and internal structure weighting all update together from a single consistent structural reference.
How It Works
Premium Discount Matrix evaluates price through a sequence of range construction and structure scoring processes:
- Swing Detection: Swing highs and lows are confirmed when a bar's high or low is the extreme across the configured swing length on both sides, introducing a confirmation delay equal to the swing length.
- Range Construction: The most recent confirmed swing high becomes the range high and the most recent confirmed swing low becomes the range low. Each new swing replaces its side of the range whether or not it extends beyond the previous boundary. The range is only drawn when the high sits above the low, and it begins at the earlier of the two anchoring swing bars, limited by the maximum range history.
- Equilibrium Calculation: The midpoint of the range defines equilibrium, and a neutral band equal to the configured percentage of the range is centered on it.
- Internal Pivot Detection: Internal pivot highs and lows are confirmed across the chart using the shorter internal pivot length, capturing minor structure at a finer scale than the dealing range swings.
- Pivot Quality Scoring: Each internal pivot receives a wick score from the rejection wick as a proportion of the candle range, and a rejection score from the ATR-normalized distance between the pivot price and the close at confirmation. The two combine into a 0-1 quality score.
- Pivot Memory Management: Scored pivots are stored in a rolling memory. Once the configured memory capacity is exceeded, the oldest pivots are removed first.
- Row Partitioning: The range is divided into the configured number of equal-height rows from range low to range high.
- Row Structure Scoring: For each row, stored internal pivots that fall within its price bounds and formed on or after the range start are counted and their quality averaged. Density saturates at four pivots, and the final structure score blends density and average quality using the configured weights.
- Zone Classification: Rows with a midpoint inside the equilibrium band are classified as equilibrium, rows above it as premium, and rows below it as discount.
- Matrix Rendering: Each row is filled in its zone color with transparency that decreases as structure score increases. A concentrated core band through the center of each row brightens with structure score, and only renders once a row carries measurable structure.
- Range and Label Rendering: The range high, range low, and dashed equilibrium line extend from the range start to the configured right extension, with RANGE HIGH, RANGE LOW, PREMIUM, EQ, and DISCOUNT labels placed at the right edge.
Together, these elements form a continuously updating dealing range map that combines zone location with evidence-weighted structural intensity at every level.
Interpretation
Premium Discount Matrix should be interpreted as a structure-weighted location framework for the current dealing range:
- Premium Zone (Red/Pink): Rows above the equilibrium band, representing the upper portion of the dealing range where price is relatively expensive. Brighter premium rows mark levels where internal pivots have repeatedly formed with strong rejection, highlighting areas of established supply within the range.
- Discount Zone (Green): Rows below the equilibrium band, representing the lower portion of the dealing range where price is relatively cheap. Brighter discount rows mark levels where internal pivots have repeatedly formed with strong rejection, highlighting areas of established demand within the range.
- Equilibrium Band (White): Rows whose midpoint falls inside the neutral band around the range midpoint, representing fair value within the current dealing range. Price trading inside the equilibrium band carries no location advantage in either direction. If the band is narrower than a single row, no rows are classified as equilibrium and the dashed midpoint line alone marks fair value.
- Row Intensity: The opacity of each row reflects its structure score. Faint rows indicate levels price has moved through with little or no pivot activity. Brighter, more opaque rows indicate levels with dense pivot formation and strong rejection behavior.
- Core Bands: The concentrated band through the center of each row sharpens as structure score increases, providing a precise visual reference for the most structurally significant levels within each zone.
- Range High and Range Low: Solid lines at the confirmed swing extremes that define the boundaries of the current dealing range. Any newly confirmed swing high or swing low replaces the corresponding boundary, redefining the range and rebuilding the matrix.
- Equilibrium Line: The dashed line at the exact range midpoint, marking the dividing level between premium and discount pricing.
- Internal Pivot Markers (◆): When enabled, diamonds mark every detected internal pivot high and low, allowing direct inspection of the structure that feeds the matrix. Only pivots within the active range and pivot memory contribute to row scoring.
Zone color, row intensity, and core band definition collectively communicate more location and structural context than a simple premium and discount split in isolation.
Signal Logic & Visual Cues
Premium Discount Matrix is a contextual framework rather than a directional signal generator. It presents two primary structural events that redefine the dealing range:
- New Range High: A newly confirmed swing high replaces the previous range high, recalculating equilibrium, redistributing all rows, and rescoring the matrix against the updated range.
- New Range Low: A newly confirmed swing low replaces the previous range low, recalculating equilibrium, redistributing all rows, and rescoring the matrix against the updated range.
Row intensity and core band brightness provide continuous secondary context throughout the life of each range, with high-scoring rows identifying the levels most likely to carry reaction significance as price revisits them.
Alert generation covers new range high and new range low confirmation events for systematic monitoring workflows.
Strategy Integration
Premium Discount Matrix fits within dealing range, premium and discount, and structure-based reaction approaches:
- Location-Filtered Entries: Favor long setups when price trades in the discount zone and short setups when price trades in the premium zone, using the matrix as a location filter for signals generated by other tools.
- Structure-Weighted Levels: Prioritize the brightest rows within each zone as reaction levels. A discount row with high structure score offers stronger evidence of demand than a faint discount row at a similar distance from equilibrium.
- Equilibrium Awareness: Treat the equilibrium band as a neutral area where location offers no edge. Setups taken inside equilibrium lack the positional advantage the framework is designed to identify and warrant reduced conviction.
- Target Planning: Use high-scoring rows in the opposing zone as structural target references. A long taken from discount can reference bright premium rows as areas where internal supply has previously formed.
- Range Rotation Tracking: Monitor range high and range low alerts to identify when the dealing range redefines, reassessing zone classification and row intensity each time a new swing confirms.
- Multi-Timeframe Range Alignment: Apply a higher-timeframe dealing range as the primary location context, engaging with lower-timeframe discount or premium rows only when they align with the corresponding higher-timeframe zone.
Technical Implementation Details
- Range Engine: Pivot-based swing high and low detection with configurable swing length; each boundary replaced by the latest confirmed swing on its side; range start derived from anchoring swing bars and clamped by maximum range history
- Structure Engine: Internal pivot detection at configurable length; wick-proportion and ATR-normalized rejection scoring combined into a 0-1 quality value; rolling pivot memory with oldest-first removal
- Scoring System: Row-based price partitioning; pivot density saturating at four pivots per row; average rejection quality per row; configurable density and rejection weighting into a single structure score capped at 1.0
- Zone Classification: Midpoint equilibrium with configurable neutral band width; row midpoint classification into premium, equilibrium, or discount
- Visualization: Structure-scaled row fills with clamped transparency; concentrated core bands at row centers; solid range boundary lines; dashed equilibrium line; zone labels projected at the right edge; optional internal pivot diamonds
- Object Management: Preallocated box, line, and label objects reused and repositioned rather than recreated, keeping object usage constant regardless of chart history. Only the current dealing range is displayed; previous ranges are not retained on the chart.
- Performance Profile: Swing and internal pivot detection with quality scoring on every bar; matrix scoring and rendering executed on the last bar and refreshed with each realtime update against the current pivot memory
Optimal Application Parameters
Timeframe Guidance:
- 1 - 5 min: Intraday dealing range mapping with shorter swing length and lower internal pivot length for responsive range updates and detailed minor structure capture
- 15 - 60 min: Session-level range analysis with balanced swing length and moderate row count for meaningful separation between premium, equilibrium, and discount levels
- 4H - Daily: Swing-level dealing range mapping with longer swing length and larger pivot memory for stable ranges and structure scoring built from extended pivot history
Suggested Baseline Configuration:
- Swing Length: 8
- Maximum Range History: 250
- ATR Length: 14
- Matrix Rows: 16
- Internal Pivot Length: 3
- Internal Pivot Memory: 80
- Pivot Density Weight: 0.60
- Rejection Weight: 0.40
- Equilibrium Width: 0.10
- Right Extension: 20
- Show Range High / Low: Enabled
- Show Labels: Enabled
- Show Internal Pivots: Disabled
These suggested parameters should be used as a baseline; their effectiveness depends on the instrument's volatility characteristics, swing structure frequency, and preferred range sensitivity, so fine-tuning is expected for optimal performance.
Parameter Calibration Notes
Use the following adjustments to refine behavior without altering the core logic:
- Range redefining too often: Increase Swing Length to require more bars of confirmation on each side, producing larger, more stable dealing ranges that update less frequently.
- Range too slow to update: Decrease Swing Length for faster swing confirmation, allowing the dealing range to track more recent structure at the cost of greater range turnover.
- Matrix too coarse: Increase Matrix Rows toward 24 for finer price resolution, isolating structurally significant levels more precisely within each zone.
- Matrix too fragmented: Decrease Matrix Rows toward 8 so that pivots group into broader rows, producing clearer high-intensity zones on instruments with scattered structure.
- Too few rows highlighted: Decrease Internal Pivot Length to detect more minor pivots inside the range, or increase Internal Pivot Memory so more historical pivots contribute to row scoring.
- Too many rows highlighted: Increase Internal Pivot Length to restrict scoring to more meaningful internal pivots, filtering out minor noise that lifts row intensity across the entire range.
- Intensity driven by clustering rather than quality: Decrease Pivot Density Weight and increase Rejection Weight so that rows are emphasized by decisive rejections rather than by frequent but weak pivots.
- Matrix appears faint overall: The maximum structure score is capped by the sum of the two weights. If Pivot Density Weight and Rejection Weight combined fall below 1.0, even the strongest rows cannot reach full intensity. Keep the combined weights near 1.0 for full visual range.
- Equilibrium band too wide or narrow: Adjust Equilibrium Width to control how much of the range is treated as neutral. Wider settings reserve premium and discount classification for the outer portions of the range only. If no white rows appear, the band is narrower than a single row; increase Equilibrium Width or Matrix Rows until at least one row midpoint falls inside it.
- Matrix not extending far enough left: Increase Maximum Range History so that ranges anchored by older swings are drawn in full and include pivots from further back.
Adjustments should be incremental and evaluated across multiple session types rather than isolated market conditions.
Performance Characteristics
High Effectiveness:
- Ranging and rotational markets where price oscillates between well-defined swing boundaries, allowing internal pivots to accumulate and producing clearly differentiated high-intensity rows within each zone
- Instruments with consistent swing structure where confirmed swings form meaningful dealing range boundaries rather than minor fluctuations
- Location-based trading approaches that benefit from filtering entries by premium and discount context rather than acting on signals regardless of range position
- Level-based execution workflows where identifying which specific prices within a zone have carried repeated reactions improves entry and target precision
Reduced Effectiveness:
- Strong impulsive trends where price moves persistently in one direction, causing the dealing range to redefine frequently and limiting the time available for internal pivots to accumulate within each range
- Extended trends where a newly confirmed swing low forms above the prior swing high or a new swing high forms below the prior swing low, temporarily producing no valid range until structure realigns
- Newly formed ranges with little internal history, where row intensity remains uniformly faint until sufficient internal pivots have formed inside the new boundaries
- Very low volatility environments where the range is narrow relative to typical candle size, compressing multiple rows into a small price area and reducing the precision of row-level scoring
- News-driven or gap-heavy instruments where abrupt price moves produce swing extremes that are not representative of the structure price is likely to revisit
Integration Guidelines
- Confluence: Combine with BOSWaves trend, momentum, or order flow tools to generate directional signals, using the matrix to confirm whether those signals occur at favorable premium or discount locations with supporting internal structure
- Intensity Assessment: Evaluate row intensity at the price level of each setup before committing. Setups at bright rows within the correct zone carry both location and structural support, while setups at faint rows rely on location alone.
- Range Awareness: Note how recently the dealing range was redefined. A freshly updated range has limited internal history, and its row intensity should be treated as developing rather than established.
- Pivot Verification: Periodically enable internal pivot markers to confirm that the pivots feeding row intensity reflect meaningful structure on the current instrument and timeframe, adjusting internal pivot length if the scored structure appears too sparse or too noisy.
- Zone Discipline: Maintain location bias aligned with the current zone until price transitions through equilibrium. Price moving from discount into the equilibrium band reduces location advantage but does not constitute premium pricing until it clears the upper edge of the band.
Disclaimer
Premium Discount Matrix [BOSWaves] is a professional-grade dealing range visualization and internal structure scoring tool. It uses swing-anchored range construction with pivot density and rejection-based level weighting but does not predict future price movements. Results depend on market conditions, instrument swing characteristics, parameter selection, and disciplined execution. BOSWaves recommends deploying this indicator within a broader analytical framework that incorporates order flow context, structural analysis, and comprehensive risk management.

คำจำกัดสิทธิ์ความรับผิดชอบ
ข้อมูลและบทความไม่ได้มีวัตถุประสงค์เพื่อก่อให้เกิดกิจกรรมทางการเงิน, การลงทุน, การซื้อขาย, ข้อเสนอแนะ หรือคำแนะนำประเภทอื่น ๆ ที่ให้หรือรับรองโดย TradingView อ่านเพิ่มเติมใน ข้อกำหนดการใช้งาน
คำจำกัดสิทธิ์ความรับผิดชอบ
ข้อมูลและบทความไม่ได้มีวัตถุประสงค์เพื่อก่อให้เกิดกิจกรรมทางการเงิน, การลงทุน, การซื้อขาย, ข้อเสนอแนะ หรือคำแนะนำประเภทอื่น ๆ ที่ให้หรือรับรองโดย TradingView อ่านเพิ่มเติมใน ข้อกำหนดการใช้งาน