Odds-Implied Price
Odds-Implied Price
OVERVIEW
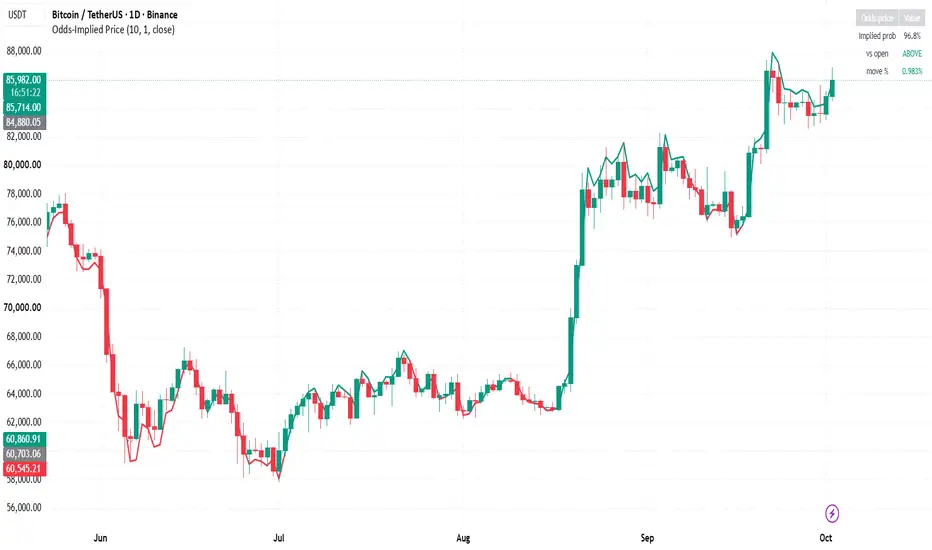
Odds-Implied Price turns a probability ("will this candle close above its open?") into a price level plotted directly on the chart. The line shows where price would need to be for that probability to be fair, measured from the candle's open. It works on any symbol and any timeframe.
THEORY
In binary-option pricing, the probability that price finishes above a strike K is:
P(up) = Φ( (S − K) / σ )
where S is the current price, σ is volatility, and Φ is the normal CDF. Inverting this gives:
S = K + σ · Φ⁻¹(P)
So any probability can be read as a distance from the strike, measured in standard deviations of volatility. The indicator applies this with the candle open as the strike and ATR as the volatility unit.
HOW IT WORKS
1. Probability input
• External mode: feed an odds series (for example prediction-market or binary "UP" odds) through "Odds source". Values in 0–1 or 0–100 are detected automatically.
• Built-in mode (default): a probability is derived from price itself, as 0.5 + 0.5·tanh((close − SMA20) / ATR20). Price stretched above its average reads as a high UP probability; stretched below reads as a low one.
2. Smoothing: an optional SMA over the probability, useful for steppy odds data.
3. Probit transform: the inverse normal CDF (Acklam approximation) converts the probability into a z-score. 50% = 0σ, ~84% = +1σ, ~16% = −1σ. Probabilities are clamped to 0.01%–99.99%.
4. Price conversion: z × k × ATR(20) / 50 gives a distance in price units, which adapts automatically to the timeframe and the asset's volatility.
5. Anchor: the distance is added to the candle open ("price to beat").
PLOTS
- Odds-Implied Price – teal when above the open (UP favored), red when below (DOWN favored).
- Open – stepped gray reference line.
- Odds-price rate – bar-to-bar change of the implied line (hidden by default; enable it and move it to a separate pane if wanted).
- Table – implied probability, ABOVE/BELOW the open, and distance from the open in %.
- Alert – fires when the implied price crosses the open, meaning the favored side has flipped.
HOW TO USE
- Compare the implied line with actual price. If the line sits above price, the probability is more bullish than the current price justifies; below means more bearish.
- A cross of the open line means the probability has crossed 50%.
- A fast-moving rate with little price movement means the probability is repricing faster than price.
- With external odds, tune "Price scale k" until the line tracks price on average. The gap that remains is the signal.
SETTINGS
- Price scale k – ATR multiple per 1σ of probability (default 10 = 0.2 ATR per σ).
- Smooth odds – SMA length on the probability.
- Use an odds source / Odds source – enables external odds input.
P.S It can work on any TF or assets I made for BINARY option of Low TF but it can be for any
NOTES
In built-in mode the probability comes from price itself, so the line shows trend and stretch relative to the open rather than independent market information. External odds input is what adds outside information.
This script is for analysis and education only and is not financial advice.
OVERVIEW
Odds-Implied Price turns a probability ("will this candle close above its open?") into a price level plotted directly on the chart. The line shows where price would need to be for that probability to be fair, measured from the candle's open. It works on any symbol and any timeframe.
THEORY
In binary-option pricing, the probability that price finishes above a strike K is:
P(up) = Φ( (S − K) / σ )
where S is the current price, σ is volatility, and Φ is the normal CDF. Inverting this gives:
S = K + σ · Φ⁻¹(P)
So any probability can be read as a distance from the strike, measured in standard deviations of volatility. The indicator applies this with the candle open as the strike and ATR as the volatility unit.
HOW IT WORKS
1. Probability input
• External mode: feed an odds series (for example prediction-market or binary "UP" odds) through "Odds source". Values in 0–1 or 0–100 are detected automatically.
• Built-in mode (default): a probability is derived from price itself, as 0.5 + 0.5·tanh((close − SMA20) / ATR20). Price stretched above its average reads as a high UP probability; stretched below reads as a low one.
2. Smoothing: an optional SMA over the probability, useful for steppy odds data.
3. Probit transform: the inverse normal CDF (Acklam approximation) converts the probability into a z-score. 50% = 0σ, ~84% = +1σ, ~16% = −1σ. Probabilities are clamped to 0.01%–99.99%.
4. Price conversion: z × k × ATR(20) / 50 gives a distance in price units, which adapts automatically to the timeframe and the asset's volatility.
5. Anchor: the distance is added to the candle open ("price to beat").
PLOTS
- Odds-Implied Price – teal when above the open (UP favored), red when below (DOWN favored).
- Open – stepped gray reference line.
- Odds-price rate – bar-to-bar change of the implied line (hidden by default; enable it and move it to a separate pane if wanted).
- Table – implied probability, ABOVE/BELOW the open, and distance from the open in %.
- Alert – fires when the implied price crosses the open, meaning the favored side has flipped.
HOW TO USE
- Compare the implied line with actual price. If the line sits above price, the probability is more bullish than the current price justifies; below means more bearish.
- A cross of the open line means the probability has crossed 50%.
- A fast-moving rate with little price movement means the probability is repricing faster than price.
- With external odds, tune "Price scale k" until the line tracks price on average. The gap that remains is the signal.
SETTINGS
- Price scale k – ATR multiple per 1σ of probability (default 10 = 0.2 ATR per σ).
- Smooth odds – SMA length on the probability.
- Use an odds source / Odds source – enables external odds input.
P.S It can work on any TF or assets I made for BINARY option of Low TF but it can be for any
NOTES
In built-in mode the probability comes from price itself, so the line shows trend and stretch relative to the open rather than independent market information. External odds input is what adds outside information.
This script is for analysis and education only and is not financial advice.

คำจำกัดสิทธิ์ความรับผิดชอบ
ข้อมูลและบทความไม่ได้มีวัตถุประสงค์เพื่อก่อให้เกิดกิจกรรมทางการเงิน, การลงทุน, การซื้อขาย, ข้อเสนอแนะ หรือคำแนะนำประเภทอื่น ๆ ที่ให้หรือรับรองโดย TradingView อ่านเพิ่มเติมใน ข้อกำหนดการใช้งาน
คำจำกัดสิทธิ์ความรับผิดชอบ
ข้อมูลและบทความไม่ได้มีวัตถุประสงค์เพื่อก่อให้เกิดกิจกรรมทางการเงิน, การลงทุน, การซื้อขาย, ข้อเสนอแนะ หรือคำแนะนำประเภทอื่น ๆ ที่ให้หรือรับรองโดย TradingView อ่านเพิ่มเติมใน ข้อกำหนดการใช้งาน