OPEN-SOURCE SCRIPT
Fibonacci Memory [Quantum Algo]
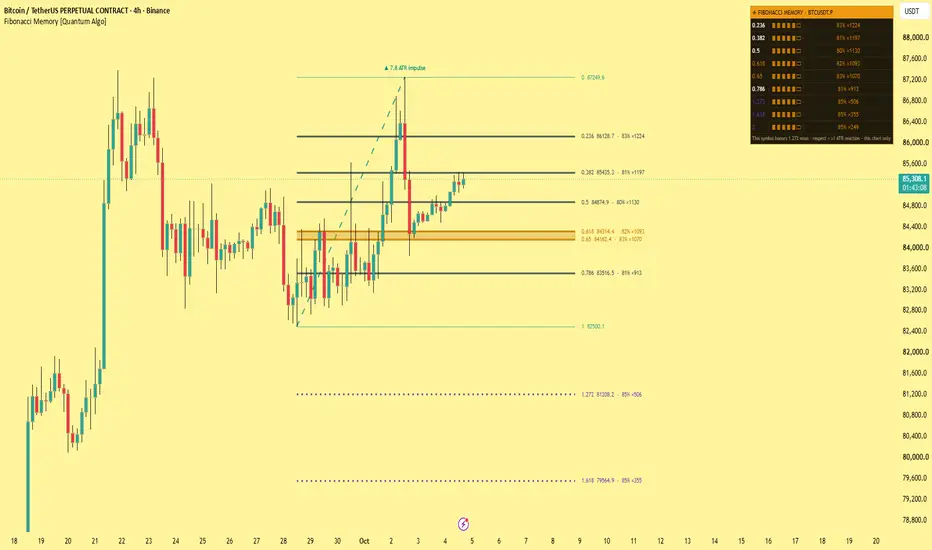
Fibonacci Memory [Quantum Algo]
═══════════════════════════════════════════════
🔶 OVERVIEW
Fibonacci Memory is an automatic Fibonacci retracement and extension tool with memory. It detects the live impulse on your chart, draws the full retracement ladder with the golden pocket shaded and the extension targets projected forward — and then does what no Fibonacci indicator does: it remembers. Every time price touches a level, the tool records whether price respected it or cut straight through, and the levels on your chart glow according to their historical respect rate on this exact symbol and timeframe.
The result is a Fibonacci map that tells you which ratios THIS market honors. On one pair the 0.618 may be a wall and the 0.5 a formality; on another it is the reverse. Fibonacci Memory shows you, with touch counts, instead of leaving you to assume every ratio is equally sacred.
═══════════════════════════════════════════════
🔶 WHAT IS FIBONACCI RETRACEMENT?
Fibonacci retracement measures how far a pullback has traveled against the impulse that preceded it, expressed as ratios derived from the Fibonacci sequence — 0.236, 0.382, 0.5, 0.618, 0.786. Traders watch these levels as candidate zones where a pullback may end and the impulse may resume. Fibonacci extension projects the same ratios beyond the impulse — 1.272, 1.618, 2.0 — as candidate targets for the next leg. The golden pocket, between 0.618 and 0.65, is the retracement zone most widely watched in contemporary trading.
═══════════════════════════════════════════════
🔶 WHAT IS LEVEL MEMORY?
Most Fibonacci tools draw the same ratios on every chart with the same confidence. Level Memory measures each ratio instead. A touch is recorded when price comes within a small tolerance of a level. The touch is then watched for a reaction window: if price moves away by at least the reaction distance, the level was RESPECTED; if not, it was ignored. Respect rates are shrunk toward neutral at small samples so a lucky early touch cannot inflate a level's standing — and they are shown on the level labels, in the panel, and as the glow of the lines themselves.
═══════════════════════════════════════════════
🔶 WHY IS THIS ORIGINAL?
1. Levels that glow by evidence. Line brightness and thickness are driven by each ratio's respect rate on the current symbol — the 0.618 is drawn bold where it has earned it and faint where it has not.
2. Per-ratio statistics panel. Every retracement and extension ratio carries a meter, a shrunk respect rate and a touch count, with a footer naming the ratio this symbol honors most.
3. Reaction markers. Each respected touch prints a small marker at the level — a visible record of the ladder doing its job, left on the chart.
4. A live impulse engine. The ladder follows the current swing automatically and extends the impulse end as the move continues, so the levels are always drawn from the structure that matters now; the impulse itself is drawn and sized in Average True Range units.
5. Golden pocket, shaded and alerted. The 0.618–0.65 zone is rendered as a band and carries its own alert.
═══════════════════════════════════════════════
🔶 HOW IT WORKS
— Pivot structure identifies the most recent swing high and low; the pair with the required minimum size defines the impulse and its direction.
— Retracement and extension levels are computed from the impulse and drawn with the golden pocket shaded.
— On each confirmed bar, a level within the touch tolerance registers a touch; the touch is resolved as respected or ignored within the reaction window.
— Each ratio's respect rate is computed with shrinkage and drives line glow, label text, the panel and the markers.
Detection and statistics run on confirmed bars. Levels redraw when a new impulse forms — this is the tool following structure, not repainting signals.
═══════════════════════════════════════════════
🔶 HOW TO USE IT
— Trade the bold lines: a level drawn bright and thick has a track record on this symbol; a faint level is decorative until proven otherwise.
— Watch the pocket with context: if the panel shows the 0.618 and 0.65 well respected here, a golden-pocket touch deserves attention; if they are faint, do not assume the textbook.
— Use extensions as target candidates weighted the same way — a 1.618 with a strong respect rate is a credible target.
— Compare symbols: load the tool on several pairs and notice how differently their panels read; that is the point.
— Works on all markets and timeframes; raise Swing Length on higher timeframes to follow larger structure.
═══════════════════════════════════════════════
🔶 SETTINGS
— Impulse: swing length, minimum leg size.
— Levels: extensions toggle, golden pocket shading, right extension.
— Level Memory: touch tolerance, reaction distance, reaction window, reaction markers, minimum touches to grade.
— Visuals: impulse, pocket, extension and neutral colors; panel toggle.
═══════════════════════════════════════════════
🔶 ALERTS
— New Impulse — the ladder redrew on a new swing.
— Level Reaction Up / Down — price respected a level.
— Golden Pocket Touched — price entered the 0.618–0.65 zone.
═══════════════════════════════════════════════
🔶 FAQ
Q: Does it repaint?
A: Touch and respect statistics are computed on confirmed bars and never change. The ladder itself redraws when a new impulse is detected, because it is drawn from the current swing — that is the tool following market structure, not a signal being altered.
Q: Why does the same ratio look different on different symbols?
A: Because the glow is evidence, not decoration. Each symbol's respect rates are measured on its own history, so a level is bold where it has worked and faint where it has not.
Q: What counts as "respected"?
A: Price came within the touch tolerance of the level and then moved away by at least the reaction distance within the reaction window. Both thresholds are in Average True Range units and are adjustable.
Q: Why is the golden pocket 0.618 to 0.65?
A: It is the zone most widely used in contemporary practice, bounded by the golden ratio retracement and the nearby 0.65. Both levels are tracked separately in the panel so you can see whether this market distinguishes them.
Q: What do the percentages mean?
A: The share of past touches of that level that were respected, shrunk toward fifty percent at small samples. They describe this chart's history; they are not predictions.
═══════════════════════════════════════════════
🔶 CREDITS
The Fibonacci sequence is attributed to Leonardo of Pisa (1202). Fibonacci retracement and extension come from classical technical analysis, popularized by Ralph Nelson Elliott and later by Robert Fischer; the golden pocket is from contemporary trading practice. Pivot structure detection is standard charting technique. The Wilson score interval is by Edwin B. Wilson (1927). The impulse engine, level-respect statistics, glow rendering, reaction markers and all code in this script are original work — no third-party or open-source script code was reused.
═══════════════════════════════════════════════
🔶 LIMITATIONS
— Respect statistics need touches to accumulate; on a fresh chart the ladder starts ungraded and brightens as evidence arrives.
— The impulse engine follows pivot structure; in choppy conditions swings are smaller and the ladder redraws more often.
— Statistics describe the current chart's history only; past frequencies never guarantee future outcomes.
═══════════════════════════════════════════════
🔶 DISCLAIMER
This indicator is a research and charting tool provided for educational purposes. It is not financial advice, and nothing it displays is a recommendation to buy or sell any asset. Trading involves substantial risk of loss. Always do your own analysis and manage risk responsibly.
═══════════════════════════════════════════════
🔶 OVERVIEW
Fibonacci Memory is an automatic Fibonacci retracement and extension tool with memory. It detects the live impulse on your chart, draws the full retracement ladder with the golden pocket shaded and the extension targets projected forward — and then does what no Fibonacci indicator does: it remembers. Every time price touches a level, the tool records whether price respected it or cut straight through, and the levels on your chart glow according to their historical respect rate on this exact symbol and timeframe.
The result is a Fibonacci map that tells you which ratios THIS market honors. On one pair the 0.618 may be a wall and the 0.5 a formality; on another it is the reverse. Fibonacci Memory shows you, with touch counts, instead of leaving you to assume every ratio is equally sacred.
═══════════════════════════════════════════════
🔶 WHAT IS FIBONACCI RETRACEMENT?
Fibonacci retracement measures how far a pullback has traveled against the impulse that preceded it, expressed as ratios derived from the Fibonacci sequence — 0.236, 0.382, 0.5, 0.618, 0.786. Traders watch these levels as candidate zones where a pullback may end and the impulse may resume. Fibonacci extension projects the same ratios beyond the impulse — 1.272, 1.618, 2.0 — as candidate targets for the next leg. The golden pocket, between 0.618 and 0.65, is the retracement zone most widely watched in contemporary trading.
═══════════════════════════════════════════════
🔶 WHAT IS LEVEL MEMORY?
Most Fibonacci tools draw the same ratios on every chart with the same confidence. Level Memory measures each ratio instead. A touch is recorded when price comes within a small tolerance of a level. The touch is then watched for a reaction window: if price moves away by at least the reaction distance, the level was RESPECTED; if not, it was ignored. Respect rates are shrunk toward neutral at small samples so a lucky early touch cannot inflate a level's standing — and they are shown on the level labels, in the panel, and as the glow of the lines themselves.
═══════════════════════════════════════════════
🔶 WHY IS THIS ORIGINAL?
1. Levels that glow by evidence. Line brightness and thickness are driven by each ratio's respect rate on the current symbol — the 0.618 is drawn bold where it has earned it and faint where it has not.
2. Per-ratio statistics panel. Every retracement and extension ratio carries a meter, a shrunk respect rate and a touch count, with a footer naming the ratio this symbol honors most.
3. Reaction markers. Each respected touch prints a small marker at the level — a visible record of the ladder doing its job, left on the chart.
4. A live impulse engine. The ladder follows the current swing automatically and extends the impulse end as the move continues, so the levels are always drawn from the structure that matters now; the impulse itself is drawn and sized in Average True Range units.
5. Golden pocket, shaded and alerted. The 0.618–0.65 zone is rendered as a band and carries its own alert.
═══════════════════════════════════════════════
🔶 HOW IT WORKS
— Pivot structure identifies the most recent swing high and low; the pair with the required minimum size defines the impulse and its direction.
— Retracement and extension levels are computed from the impulse and drawn with the golden pocket shaded.
— On each confirmed bar, a level within the touch tolerance registers a touch; the touch is resolved as respected or ignored within the reaction window.
— Each ratio's respect rate is computed with shrinkage and drives line glow, label text, the panel and the markers.
Detection and statistics run on confirmed bars. Levels redraw when a new impulse forms — this is the tool following structure, not repainting signals.
═══════════════════════════════════════════════
🔶 HOW TO USE IT
— Trade the bold lines: a level drawn bright and thick has a track record on this symbol; a faint level is decorative until proven otherwise.
— Watch the pocket with context: if the panel shows the 0.618 and 0.65 well respected here, a golden-pocket touch deserves attention; if they are faint, do not assume the textbook.
— Use extensions as target candidates weighted the same way — a 1.618 with a strong respect rate is a credible target.
— Compare symbols: load the tool on several pairs and notice how differently their panels read; that is the point.
— Works on all markets and timeframes; raise Swing Length on higher timeframes to follow larger structure.
═══════════════════════════════════════════════
🔶 SETTINGS
— Impulse: swing length, minimum leg size.
— Levels: extensions toggle, golden pocket shading, right extension.
— Level Memory: touch tolerance, reaction distance, reaction window, reaction markers, minimum touches to grade.
— Visuals: impulse, pocket, extension and neutral colors; panel toggle.
═══════════════════════════════════════════════
🔶 ALERTS
— New Impulse — the ladder redrew on a new swing.
— Level Reaction Up / Down — price respected a level.
— Golden Pocket Touched — price entered the 0.618–0.65 zone.
═══════════════════════════════════════════════
🔶 FAQ
Q: Does it repaint?
A: Touch and respect statistics are computed on confirmed bars and never change. The ladder itself redraws when a new impulse is detected, because it is drawn from the current swing — that is the tool following market structure, not a signal being altered.
Q: Why does the same ratio look different on different symbols?
A: Because the glow is evidence, not decoration. Each symbol's respect rates are measured on its own history, so a level is bold where it has worked and faint where it has not.
Q: What counts as "respected"?
A: Price came within the touch tolerance of the level and then moved away by at least the reaction distance within the reaction window. Both thresholds are in Average True Range units and are adjustable.
Q: Why is the golden pocket 0.618 to 0.65?
A: It is the zone most widely used in contemporary practice, bounded by the golden ratio retracement and the nearby 0.65. Both levels are tracked separately in the panel so you can see whether this market distinguishes them.
Q: What do the percentages mean?
A: The share of past touches of that level that were respected, shrunk toward fifty percent at small samples. They describe this chart's history; they are not predictions.
═══════════════════════════════════════════════
🔶 CREDITS
The Fibonacci sequence is attributed to Leonardo of Pisa (1202). Fibonacci retracement and extension come from classical technical analysis, popularized by Ralph Nelson Elliott and later by Robert Fischer; the golden pocket is from contemporary trading practice. Pivot structure detection is standard charting technique. The Wilson score interval is by Edwin B. Wilson (1927). The impulse engine, level-respect statistics, glow rendering, reaction markers and all code in this script are original work — no third-party or open-source script code was reused.
═══════════════════════════════════════════════
🔶 LIMITATIONS
— Respect statistics need touches to accumulate; on a fresh chart the ladder starts ungraded and brightens as evidence arrives.
— The impulse engine follows pivot structure; in choppy conditions swings are smaller and the ladder redraws more often.
— Statistics describe the current chart's history only; past frequencies never guarantee future outcomes.
═══════════════════════════════════════════════
🔶 DISCLAIMER
This indicator is a research and charting tool provided for educational purposes. It is not financial advice, and nothing it displays is a recommendation to buy or sell any asset. Trading involves substantial risk of loss. Always do your own analysis and manage risk responsibly.
สคริปต์แบบโอเพนซอร์ส
ด้วยเจตนารมณ์หลักของ TradingView ผู้สร้างสคริปต์นี้ได้ทำให้เป็นโอเพนซอร์ส เพื่อให้เทรดเดอร์สามารถตรวจสอบและยืนยันฟังก์ชันการทำงานของมันได้ ขอชื่นชมผู้เขียน! แม้ว่าคุณจะใช้งานได้ฟรี แต่โปรดจำไว้ว่าการเผยแพร่โค้ดซ้ำจะต้องเป็นไปตาม กฎระเบียบการใช้งาน ของเรา

The institutional Edge: Indicators, Strategies & a Free Academy. quantum-algo.com
All content provided by Quantum Algo is for informational & educational purposes only.
All content provided by Quantum Algo is for informational & educational purposes only.
คำจำกัดสิทธิ์ความรับผิดชอบ
ข้อมูลและบทความไม่ได้มีวัตถุประสงค์เพื่อก่อให้เกิดกิจกรรมทางการเงิน, การลงทุน, การซื้อขาย, ข้อเสนอแนะ หรือคำแนะนำประเภทอื่น ๆ ที่ให้หรือรับรองโดย TradingView อ่านเพิ่มเติมใน ข้อกำหนดการใช้งาน
สคริปต์แบบโอเพนซอร์ส
ด้วยเจตนารมณ์หลักของ TradingView ผู้สร้างสคริปต์นี้ได้ทำให้เป็นโอเพนซอร์ส เพื่อให้เทรดเดอร์สามารถตรวจสอบและยืนยันฟังก์ชันการทำงานของมันได้ ขอชื่นชมผู้เขียน! แม้ว่าคุณจะใช้งานได้ฟรี แต่โปรดจำไว้ว่าการเผยแพร่โค้ดซ้ำจะต้องเป็นไปตาม กฎระเบียบการใช้งาน ของเรา
The institutional Edge: Indicators, Strategies & a Free Academy. quantum-algo.com
All content provided by Quantum Algo is for informational & educational purposes only.
All content provided by Quantum Algo is for informational & educational purposes only.
คำจำกัดสิทธิ์ความรับผิดชอบ
ข้อมูลและบทความไม่ได้มีวัตถุประสงค์เพื่อก่อให้เกิดกิจกรรมทางการเงิน, การลงทุน, การซื้อขาย, ข้อเสนอแนะ หรือคำแนะนำประเภทอื่น ๆ ที่ให้หรือรับรองโดย TradingView อ่านเพิ่มเติมใน ข้อกำหนดการใช้งาน