Flow Control: Volume, CVD & Delta [Artio]
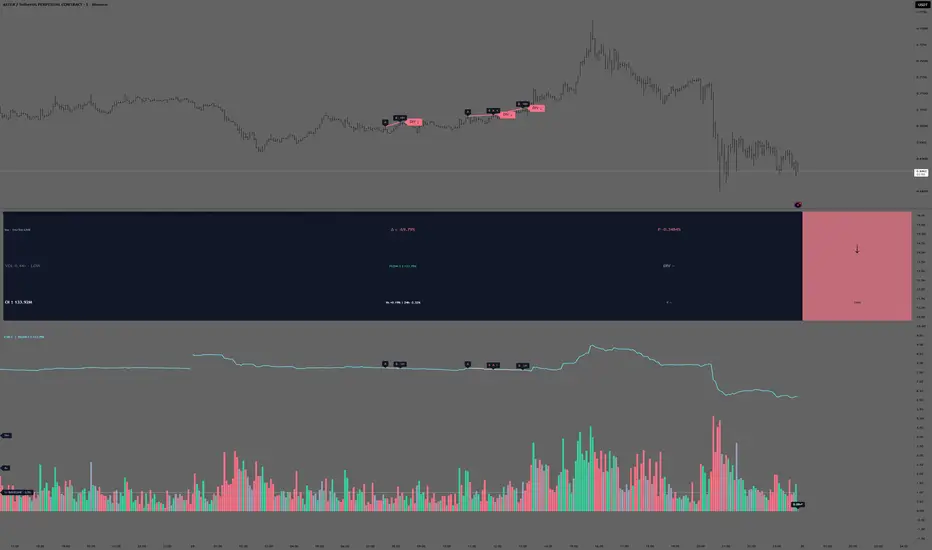
Volume tells us how much activity took place. Delta estimates which direction dominated that activity. CVD shows how that imbalance accumulates over time.
But one of the most interesting questions is what price actually did in response.
Flow Control brings relative volume, estimated delta, CVD and price response together in one workspace. It is designed to help traders identify unusual activity, directional agreement, possible absorption and divergences without relying on volume bars alone.
One panel, multiple perspectives
The default layout combines a full history of relative-volume columns, a separate visual CVD lane and a compact market-response dashboard.
Several views are available:
Relative Volume
Rather than showing raw volume alone, Flow Control measures candle activity against the median of previous completed candles.
A reading of 2.0x means the observed volume is approximately twice its reference.
For developing candles, the LIVE dashboard can use completed lower-timeframe portions compared with equivalent portions of previous candles. This avoids simply extrapolating the current volume from elapsed time.
The historical columns and LIVE header answer different questions, so their values may differ.
Estimated Delta and CVD
The indicator estimates directional volume using smaller candles.
Positive and negative lower-timeframe candle volume contribute to an estimated delta, which is accumulated into CVD.
The source resolution adapts to the chart timeframe and can be adjusted manually. CVD resets can follow a UTC day, week or month, or remain continuous when the selected profile allows it.
Missing source observations and reset boundaries are not silently joined into an uninterrupted CVD history.
IMPORTANT: This is candle-classified volume, not actual exchange aggressor-side trade data. Estimated delta and CVD should not be interpreted as exact bid/ask execution records.
CONTROL — understanding price response
The CONTROL tile compares estimated delta with the observed price movement over the same horizon.
BUY PRESSURE — estimated buying pressure agrees with upward price movement.
SELL PRESSURE — estimated selling pressure agrees with downward price movement.
CONFLICT — directional pressure does not receive a corresponding price response.
BALANCED — no sufficiently strong directional imbalance is detected.
THIN — price movement is directionally aligned, but relative volume is low.
A conflict can be useful when investigating possible absorption or a failed price push. It does not independently confirm either phenomenon or provide an entry signal.
Price and CVD divergences
Flow Control compares confirmed price swing points with their corresponding CVD observations.
A bullish divergence candidate may appear when price makes a lower low while CVD forms a higher low.
A bearish divergence candidate may appear when price makes a higher high while CVD forms a lower high.
Confirmed divergences are annotated at their discovery time, with optional connected lines on the main price chart.
Provisional LIVE candidates are marked DIV? and can disappear before confirmation.
Additional market context
Optional Open Interest data can be displayed from a matching TradingView OI series, including changes over one hour and 24 hours where available.
An external Funding Rate plot can also be connected manually.
OI and Funding are contextual measurements. They do not become extra directional votes in the CONTROL state.
Language and alerts
English is the default interface language. Russian is available under Language / Язык.
The compact dashboard, explanations, divergence annotations and LIVE alert messages follow the selected language.
Optional alerts describe changes in completed short-window activity. Separate English and Russian alert conditions are provided for confirmed CVD divergences.
Important limitations
Flow Control does not read a complete exchange order book, MBO data or actual taker-side trade flags.
The availability of lower-timeframe volume, OI and Funding depends on the TradingView feed and instrument. Forex/CFD volume may represent tick activity rather than exchange-traded contract volume.
CVD is an estimate. Divergences are observations, not reliable predictions of reversals. Historical pivot confirmation requires bars to the right, and LIVE observations may change before the chart candle closes.
The indicator does not place trades, provide tested success probabilities or replace independent risk management.
Built in Pine Script v6. Developed for practical market observation and discretionary trading analysis.
But one of the most interesting questions is what price actually did in response.
Flow Control brings relative volume, estimated delta, CVD and price response together in one workspace. It is designed to help traders identify unusual activity, directional agreement, possible absorption and divergences without relying on volume bars alone.
One panel, multiple perspectives
The default layout combines a full history of relative-volume columns, a separate visual CVD lane and a compact market-response dashboard.
Several views are available:
- DESK — relative volume, CVD and the compact CONTROL dashboard.
- VOLUME — historical candle volume relative to its baseline.
- CVD — cumulative estimated delta in its native volume units.
- NOW — completed short-window volume observations.
- BAR — candle-volume analysis with a matching elapsed-time reference.
Relative Volume
Rather than showing raw volume alone, Flow Control measures candle activity against the median of previous completed candles.
A reading of 2.0x means the observed volume is approximately twice its reference.
For developing candles, the LIVE dashboard can use completed lower-timeframe portions compared with equivalent portions of previous candles. This avoids simply extrapolating the current volume from elapsed time.
The historical columns and LIVE header answer different questions, so their values may differ.
Estimated Delta and CVD
The indicator estimates directional volume using smaller candles.
Positive and negative lower-timeframe candle volume contribute to an estimated delta, which is accumulated into CVD.
The source resolution adapts to the chart timeframe and can be adjusted manually. CVD resets can follow a UTC day, week or month, or remain continuous when the selected profile allows it.
Missing source observations and reset boundaries are not silently joined into an uninterrupted CVD history.
IMPORTANT: This is candle-classified volume, not actual exchange aggressor-side trade data. Estimated delta and CVD should not be interpreted as exact bid/ask execution records.
CONTROL — understanding price response
The CONTROL tile compares estimated delta with the observed price movement over the same horizon.
BUY PRESSURE — estimated buying pressure agrees with upward price movement.
SELL PRESSURE — estimated selling pressure agrees with downward price movement.
CONFLICT — directional pressure does not receive a corresponding price response.
BALANCED — no sufficiently strong directional imbalance is detected.
THIN — price movement is directionally aligned, but relative volume is low.
A conflict can be useful when investigating possible absorption or a failed price push. It does not independently confirm either phenomenon or provide an entry signal.
Price and CVD divergences
Flow Control compares confirmed price swing points with their corresponding CVD observations.
A bullish divergence candidate may appear when price makes a lower low while CVD forms a higher low.
A bearish divergence candidate may appear when price makes a higher high while CVD forms a lower high.
Confirmed divergences are annotated at their discovery time, with optional connected lines on the main price chart.
Provisional LIVE candidates are marked DIV? and can disappear before confirmation.
Additional market context
Optional Open Interest data can be displayed from a matching TradingView OI series, including changes over one hour and 24 hours where available.
An external Funding Rate plot can also be connected manually.
OI and Funding are contextual measurements. They do not become extra directional votes in the CONTROL state.
Language and alerts
English is the default interface language. Russian is available under Language / Язык.
The compact dashboard, explanations, divergence annotations and LIVE alert messages follow the selected language.
Optional alerts describe changes in completed short-window activity. Separate English and Russian alert conditions are provided for confirmed CVD divergences.
Important limitations
Flow Control does not read a complete exchange order book, MBO data or actual taker-side trade flags.
The availability of lower-timeframe volume, OI and Funding depends on the TradingView feed and instrument. Forex/CFD volume may represent tick activity rather than exchange-traded contract volume.
CVD is an estimate. Divergences are observations, not reliable predictions of reversals. Historical pivot confirmation requires bars to the right, and LIVE observations may change before the chart candle closes.
The indicator does not place trades, provide tested success probabilities or replace independent risk management.
Built in Pine Script v6. Developed for practical market observation and discretionary trading analysis.

คำจำกัดสิทธิ์ความรับผิดชอบ
ข้อมูลและบทความไม่ได้มีวัตถุประสงค์เพื่อก่อให้เกิดกิจกรรมทางการเงิน, การลงทุน, การซื้อขาย, ข้อเสนอแนะ หรือคำแนะนำประเภทอื่น ๆ ที่ให้หรือรับรองโดย TradingView อ่านเพิ่มเติมใน ข้อกำหนดการใช้งาน
คำจำกัดสิทธิ์ความรับผิดชอบ
ข้อมูลและบทความไม่ได้มีวัตถุประสงค์เพื่อก่อให้เกิดกิจกรรมทางการเงิน, การลงทุน, การซื้อขาย, ข้อเสนอแนะ หรือคำแนะนำประเภทอื่น ๆ ที่ให้หรือรับรองโดย TradingView อ่านเพิ่มเติมใน ข้อกำหนดการใช้งาน