OPEN-SOURCE SCRIPT
Bang! Bang! - Candle Anomalies
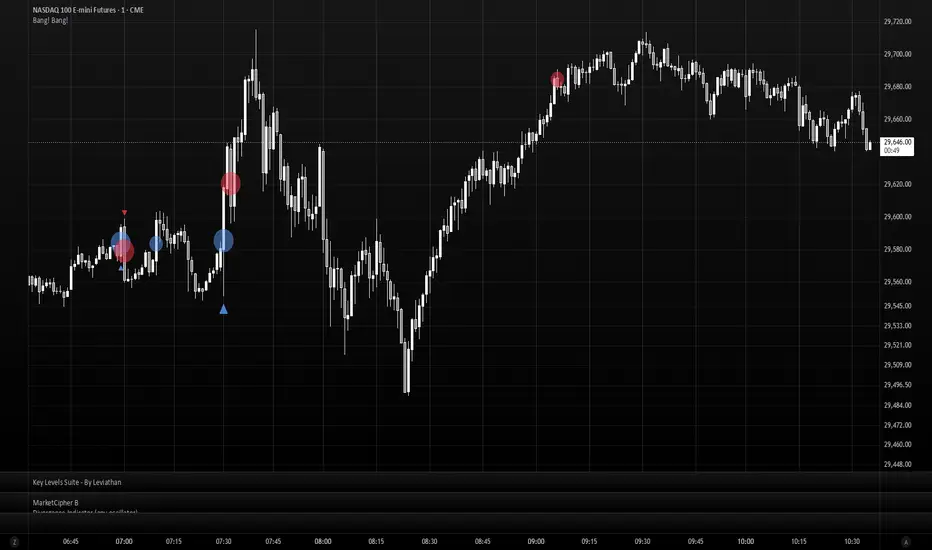
Bang! Bang! — Candle Anomalies
Overview
Bang! Bang! is a volume-anomaly detector. It flags bars where volume looks unusual against its recent neighbors and tags each anomaly with a direction (buy or sell), a tier (Bang! for notable, Bang! Bang! for extreme), and a placement on the chart that reflects where the activity actually concentrated.
Two independent detection pipelines can run side by side. Each one decides for itself when to fire, picks its own engine (bar-level or sub-bar level), and uses its own statistical threshold method. You can run both pipelines together for confluence, or just one for a cleaner chart. The indicator works on any chart type — time-based, Renko, Range, Point & Figure, Kagi, and Line Break — with intelligent fallback when a particular engine isn't available for the chart you're on.
Features
Two detection engines (picked per baseline mode):
- Intensity Engine (default) — bar-level volume analysis. Works on any chart type. A Volume Basis input lets you pick plain `volume` or `volume / bar duration` (a volume rate that respects how urgently a bar formed). The plain-volume basis turns this into a pure volume-anomaly detector; the rate basis is what makes the engine meaningful on non-time-based charts where bar duration varies.
- Delta Engine — sub-bar decomposition via lower-timeframe candles. Splits the chart bar's volume into buy-side and sell-side based on sub-bar direction, and places the dot at the highest-volume sub-bar's hl2 (so the mark lands where the activity actually concentrated within the bar). Time-based charts only; on Renko, Range, P&F, Kagi, and Line Break it silently falls back to Intensity.
*Note on the Lower Timeframe input:* the default is 1 minute, which works on every TradingView plan. If you have a Premium account, dropping the Lower Timeframe to a seconds-based value like 5S gives much finer sub-bar resolution and noticeably sharper direction and placement attribution from the Delta Engine.
Three threshold methods (picked per baseline mode):
- Sigma (default) — mean + N × stdev. The classical mean + standard deviation model.
- MAD — median + N × MAD × 1.4826. Robust to outliers, since the events being detected don't contaminate the baseline.
- Percentile — top X% of the rolling window. Distribution-agnostic and well-suited to heavy-tailed volume data.
Two independent baseline modes (both enabled by default):
- Unified Baseline — one rolling baseline on the full magnitude signal, with direction tagged separately. Best when you want a single, robust "this bar is unusual" call.
- Parallel Baseline — two rolling baselines, one for buy-side magnitude and one for sell-side. The side whose magnitude jumps gets the dot. Surfaces cases where one side of the flow becomes unusual independently of the other.
Each mode has its own Engine, Threshold Method, and Volume Basis, so you can configure them differently in the same chart (e.g., Unified on Sigma + Intensity for a stable baseline, Parallel on Percentile + Delta for sub-bar attribution).
Shooting Blanks overlay (Delta Engine only) — a small yellow dot when a Bang! or Bang! Bang! Delta dot fires AND the bar closes against its sub-bar flow direction. A "where did all that flow go?" tell that highlights bars where the heavy side of the sub-bar flow didn't carry the close — useful for spotting absorption-like patterns, late-bar reversals, and liquidity events.
Per-mode color customization — 14 user-configurable color slots across four groups (Unified Intensity, Unified Delta, Parallel Intensity, Parallel Delta), so each mode/engine combination can be styled independently. The Delta gradient is a five-step scale (Heavy Buyers → Light Buyers → Balanced → Light Sellers → Heavy Sellers) so dot color encodes conviction.
18 alert conditions — 9 per baseline mode, suffixed `(Unified)` or `(Parallel)` so per-mode firings stay unambiguous: `Bang!`, `Bang! Bang!`, `Bang! Buy`, `Bang! Sell`, `Bang! Bang! Buy`, `Bang! Bang! Sell`, `Bang! Bang! Balanced`, `Shooting Blanks (Buyers Failed)`, `Shooting Blanks (Sellers Failed)`.
Sensible, conservative defaults — Sensitivity = 6.0 and Tier Spacing = 2.0 by default, so Bang! fires at 6σ and Bang! Bang! at 8σ above the rolling mean. Tuned for the strongest anomalies only; turn them down for more frequent signals.
Visuals
The indicator plots up to three types of marks per bar:
Triangles — Unified Baseline
- **Triangle Up** appears below the bar when the magnitude jumped on a buy-direction bar.
- **Triangle Down** appears above the bar when the magnitude jumped on a sell-direction bar.
- **Size** encodes the tier — small triangle for Bang!, slightly larger triangle for Bang! Bang!.
- **Color** comes from the Unified color inputs (default 80% opacity so the smaller triangles read clearly).
Circles — Parallel Baseline
- A circle is placed at the bar's hl2 (Intensity Engine) or at the highest-volume sub-bar's hl2 (Delta Engine).
- **Size** encodes the tier — normal circle for Bang!, large circle for Bang! Bang!.
- **Color** comes from the Parallel color inputs (default 50% opacity).
When the **Delta Engine** is active in either mode, dot color also encodes sub-bar flow direction via a five-step gradient:
- **Heavy Buyers** — strongly buy-dominated sub-bar flow
- **Light Buyers** — moderately buy-leaning
- **Balanced** — roughly balanced buy/sell sub-bars (the neutral-grey middle of the gradient)
- **Light Sellers** — moderately sell-leaning
- **Heavy Sellers** — strongly sell-dominated
Shooting Blanks yellow dot
- A small yellow circle at the highest-volume sub-bar's hl2 when the Delta engine fires AND the close direction contradicts the sub-bar flow direction.
- Renders on top of any main dot sharing the same location, so the divergence reads at a glance.
- One shared dot per qualifying bar regardless of how many baseline modes detected the anomaly.
When both baseline modes fire on the same bar — Unified detecting a magnitude jump and Parallel detecting a side-specific jump — you'll see both marks together: a triangle outside the bar plus a circle inside it. Two independent confirmations from two different baseline approaches.
---
*Inspired by colacorn's "Big Trades Whale Detector" — full credit for the core concept of statistical volume-anomaly detection on candle bars.*
Overview
Bang! Bang! is a volume-anomaly detector. It flags bars where volume looks unusual against its recent neighbors and tags each anomaly with a direction (buy or sell), a tier (Bang! for notable, Bang! Bang! for extreme), and a placement on the chart that reflects where the activity actually concentrated.
Two independent detection pipelines can run side by side. Each one decides for itself when to fire, picks its own engine (bar-level or sub-bar level), and uses its own statistical threshold method. You can run both pipelines together for confluence, or just one for a cleaner chart. The indicator works on any chart type — time-based, Renko, Range, Point & Figure, Kagi, and Line Break — with intelligent fallback when a particular engine isn't available for the chart you're on.
Features
Two detection engines (picked per baseline mode):
- Intensity Engine (default) — bar-level volume analysis. Works on any chart type. A Volume Basis input lets you pick plain `volume` or `volume / bar duration` (a volume rate that respects how urgently a bar formed). The plain-volume basis turns this into a pure volume-anomaly detector; the rate basis is what makes the engine meaningful on non-time-based charts where bar duration varies.
- Delta Engine — sub-bar decomposition via lower-timeframe candles. Splits the chart bar's volume into buy-side and sell-side based on sub-bar direction, and places the dot at the highest-volume sub-bar's hl2 (so the mark lands where the activity actually concentrated within the bar). Time-based charts only; on Renko, Range, P&F, Kagi, and Line Break it silently falls back to Intensity.
*Note on the Lower Timeframe input:* the default is 1 minute, which works on every TradingView plan. If you have a Premium account, dropping the Lower Timeframe to a seconds-based value like 5S gives much finer sub-bar resolution and noticeably sharper direction and placement attribution from the Delta Engine.
Three threshold methods (picked per baseline mode):
- Sigma (default) — mean + N × stdev. The classical mean + standard deviation model.
- MAD — median + N × MAD × 1.4826. Robust to outliers, since the events being detected don't contaminate the baseline.
- Percentile — top X% of the rolling window. Distribution-agnostic and well-suited to heavy-tailed volume data.
Two independent baseline modes (both enabled by default):
- Unified Baseline — one rolling baseline on the full magnitude signal, with direction tagged separately. Best when you want a single, robust "this bar is unusual" call.
- Parallel Baseline — two rolling baselines, one for buy-side magnitude and one for sell-side. The side whose magnitude jumps gets the dot. Surfaces cases where one side of the flow becomes unusual independently of the other.
Each mode has its own Engine, Threshold Method, and Volume Basis, so you can configure them differently in the same chart (e.g., Unified on Sigma + Intensity for a stable baseline, Parallel on Percentile + Delta for sub-bar attribution).
Shooting Blanks overlay (Delta Engine only) — a small yellow dot when a Bang! or Bang! Bang! Delta dot fires AND the bar closes against its sub-bar flow direction. A "where did all that flow go?" tell that highlights bars where the heavy side of the sub-bar flow didn't carry the close — useful for spotting absorption-like patterns, late-bar reversals, and liquidity events.
Per-mode color customization — 14 user-configurable color slots across four groups (Unified Intensity, Unified Delta, Parallel Intensity, Parallel Delta), so each mode/engine combination can be styled independently. The Delta gradient is a five-step scale (Heavy Buyers → Light Buyers → Balanced → Light Sellers → Heavy Sellers) so dot color encodes conviction.
18 alert conditions — 9 per baseline mode, suffixed `(Unified)` or `(Parallel)` so per-mode firings stay unambiguous: `Bang!`, `Bang! Bang!`, `Bang! Buy`, `Bang! Sell`, `Bang! Bang! Buy`, `Bang! Bang! Sell`, `Bang! Bang! Balanced`, `Shooting Blanks (Buyers Failed)`, `Shooting Blanks (Sellers Failed)`.
Sensible, conservative defaults — Sensitivity = 6.0 and Tier Spacing = 2.0 by default, so Bang! fires at 6σ and Bang! Bang! at 8σ above the rolling mean. Tuned for the strongest anomalies only; turn them down for more frequent signals.
Visuals
The indicator plots up to three types of marks per bar:
Triangles — Unified Baseline
- **Triangle Up** appears below the bar when the magnitude jumped on a buy-direction bar.
- **Triangle Down** appears above the bar when the magnitude jumped on a sell-direction bar.
- **Size** encodes the tier — small triangle for Bang!, slightly larger triangle for Bang! Bang!.
- **Color** comes from the Unified color inputs (default 80% opacity so the smaller triangles read clearly).
Circles — Parallel Baseline
- A circle is placed at the bar's hl2 (Intensity Engine) or at the highest-volume sub-bar's hl2 (Delta Engine).
- **Size** encodes the tier — normal circle for Bang!, large circle for Bang! Bang!.
- **Color** comes from the Parallel color inputs (default 50% opacity).
When the **Delta Engine** is active in either mode, dot color also encodes sub-bar flow direction via a five-step gradient:
- **Heavy Buyers** — strongly buy-dominated sub-bar flow
- **Light Buyers** — moderately buy-leaning
- **Balanced** — roughly balanced buy/sell sub-bars (the neutral-grey middle of the gradient)
- **Light Sellers** — moderately sell-leaning
- **Heavy Sellers** — strongly sell-dominated
Shooting Blanks yellow dot
- A small yellow circle at the highest-volume sub-bar's hl2 when the Delta engine fires AND the close direction contradicts the sub-bar flow direction.
- Renders on top of any main dot sharing the same location, so the divergence reads at a glance.
- One shared dot per qualifying bar regardless of how many baseline modes detected the anomaly.
When both baseline modes fire on the same bar — Unified detecting a magnitude jump and Parallel detecting a side-specific jump — you'll see both marks together: a triangle outside the bar plus a circle inside it. Two independent confirmations from two different baseline approaches.
---
*Inspired by colacorn's "Big Trades Whale Detector" — full credit for the core concept of statistical volume-anomaly detection on candle bars.*
สคริปต์โอเพนซอร์ซ
ด้วยเจตนารมณ์หลักของ TradingView ผู้สร้างสคริปต์นี้ได้ทำให้เป็นโอเพนซอร์ส เพื่อให้เทรดเดอร์สามารถตรวจสอบและยืนยันฟังก์ชันการทำงานของมันได้ ขอชื่นชมผู้เขียน! แม้ว่าคุณจะใช้งานได้ฟรี แต่โปรดจำไว้ว่าการเผยแพร่โค้ดซ้ำจะต้องเป็นไปตาม กฎระเบียบการใช้งาน ของเรา

คำจำกัดสิทธิ์ความรับผิดชอบ
ข้อมูลและบทความไม่ได้มีวัตถุประสงค์เพื่อก่อให้เกิดกิจกรรมทางการเงิน, การลงทุน, การซื้อขาย, ข้อเสนอแนะ หรือคำแนะนำประเภทอื่น ๆ ที่ให้หรือรับรองโดย TradingView อ่านเพิ่มเติมใน ข้อกำหนดการใช้งาน
สคริปต์โอเพนซอร์ซ
ด้วยเจตนารมณ์หลักของ TradingView ผู้สร้างสคริปต์นี้ได้ทำให้เป็นโอเพนซอร์ส เพื่อให้เทรดเดอร์สามารถตรวจสอบและยืนยันฟังก์ชันการทำงานของมันได้ ขอชื่นชมผู้เขียน! แม้ว่าคุณจะใช้งานได้ฟรี แต่โปรดจำไว้ว่าการเผยแพร่โค้ดซ้ำจะต้องเป็นไปตาม กฎระเบียบการใช้งาน ของเรา
คำจำกัดสิทธิ์ความรับผิดชอบ
ข้อมูลและบทความไม่ได้มีวัตถุประสงค์เพื่อก่อให้เกิดกิจกรรมทางการเงิน, การลงทุน, การซื้อขาย, ข้อเสนอแนะ หรือคำแนะนำประเภทอื่น ๆ ที่ให้หรือรับรองโดย TradingView อ่านเพิ่มเติมใน ข้อกำหนดการใช้งาน