Hedging Wall Indicator [HWI]
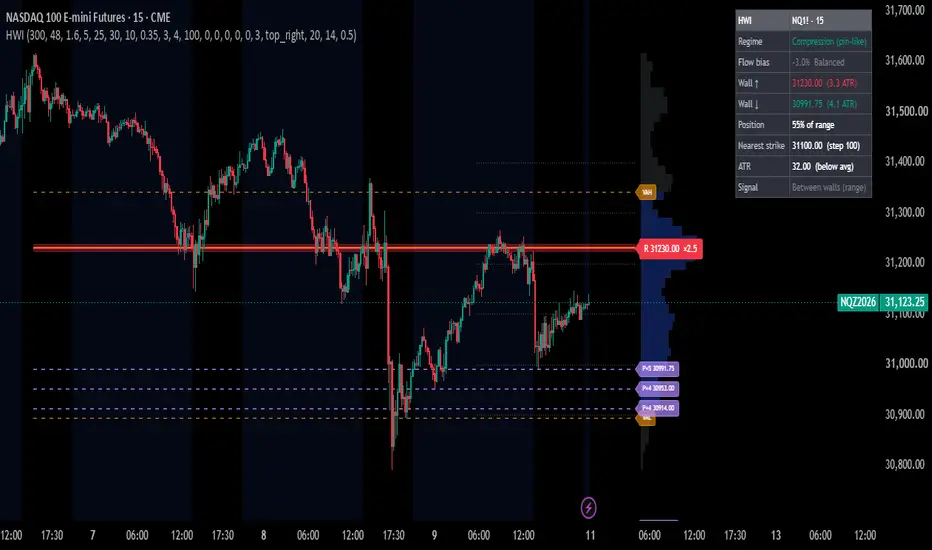
The Hedging Wall Indicator plots the price levels where hedging flows, resting liquidity and options positioning tend to concentrate. Traders often watch these zones for pinning, rejection, bounce, breakout and acceleration. It combines five layers on one chart:
Manual options walls: Call Wall, Put Wall, Gamma Flip, Max Pain
Automatic volume walls: high-volume nodes (HVN) from a volume profile, plus POC / VAH / VAL
Automatic pivot liquidity clusters: levels rejected repeatedly
Strike grid: round-number strikes that often act as magnets
Confluence (★), nearest-wall tracking, ATR distance, flow bias, regime proxy, dashboard and alerts
⚙️ How it works
1) Volume walls (auto)
The script builds a volume profile over the last N bars (default 300) split into rows (default 48). Each bar’s volume is spread across the rows its high-low range touched. A row becomes a wall when it is a local peak and its volume exceeds the average row volume × the HVN threshold (default 1.6×).
Walls above price are drawn red (R, resistance). Walls below price are drawn green (S, support).
The label shows the price and strength (for example ×2.4 means 2.4× average row volume).
It also plots POC (highest-volume price), VAH and VAL (a 70% value area), and an optional profile histogram on the right.
If a symbol has no volume data, it falls back to time-at-price.
2) Pivot liquidity clusters (auto)
Pivot highs and lows are stored and grouped when they fall within a tolerance (default 0.35 × ATR). A cluster needs a minimum number of touches (default 3). The label P×4 means four pivots clustered at that price. These are levels the market has repeatedly respected.
3) Manual options walls
Enter values in the settings. A value of 0 turns that level off.
Call Wall: strike with the largest call open interest or gamma (resistance).
Put Wall: strike with the largest put open interest or gamma (support).
Gamma Flip: above it, dealers are typically long gamma (moves dampen, mean reversion). Below it, they are short gamma (moves can amplify).
Max Pain: strike where option holders lose the most, often a magnet near expiry.
4) Strike grid
Dotted lines at round-number strikes above and below price. The step is automatic (based on price) or user-defined.
5) Confluence ★
When a volume wall lines up with a pivot cluster, the wall gets a ★ and a thicker line. These are the highest-priority levels on the chart.
6) Flow bias
A close-location-value delta proxy, averaged over a set length and shown from -100% to +100%. It estimates buy or sell pressure from where each bar closes within its range. It is not true order flow or footprint data.
7) Regime
If Gamma Flip is set: price above it shows Positive Γ (pin / mean-revert) and price below it shows Negative Γ (expand / momentum).
If not set: it falls back to an ATR compression / expansion proxy.
How to use it (step by step)
Use a futures chart with real volume (for example ES1!, NQ1!, GC1!, CL1!) on a 5m to 1h timeframe for intraday, or 4h to D for swing context.
Enter your options levels (Call Wall, Put Wall, Gamma Flip, Max Pain) in the settings from your data provider. Update them every day or whenever the data changes. The lines are static horizontals and do not update themselves.
Match the futures price. If your options data is quoted for the index or ETF (SPX, SPY, QQQ), convert it to the futures price (add the basis) before typing it in. A wrong basis is the most common reason levels look off.
Identify high-priority zones. Start with ★ confluence walls and any wall that coincides with a manual options level.
Read the dashboard:
Wall ↑ / Wall ↓: nearest levels and their distance in ATR
Position: where price sits between the two walls (% of range)
Regime and Flow bias: the context
Signal: the current reading
Interpret the Signal field:
Between walls (range): price is far from levels, so range logic is more likely.
Rejection risk at wall ↑ / Bounce risk at wall ↓: price is near a wall with no flow confirmation.
Breakout attempt ↑ / Breakdown attempt ↓: price is near a wall and flow is pushing through it.
Confirm with your own strategy (market structure, order flow, session levels, risk rules) before acting. HWI is context, not a trigger.
Tips for best performance
Keep Lookback large enough to cover the current swing or session, but not so large that old, irrelevant volume dominates.
Raise the HVN threshold (2.0+) for cleaner, fewer walls. Lower it to see more.
Raise Min touches or the Pivot length for stronger, rarer pivot clusters.
Positive-gamma conditions tend to favor fade or mean-reversion logic, and negative-gamma conditions favor momentum logic. Treat this as a bias, not a rule.
Near options expiry (0DTE, weekly, monthly), Max Pain and strike levels tend to matter more.
Combine ★ confluence walls with your own stop placement. A wall is a zone, not an exact tick.
Reduce clutter by turning off the histogram, the grid or the pivot layer.
🔔 Alerts and signals
Alert conditions available:
HWI: Break above wall: price closed above the nearest wall.
HWI: Break below wall: price closed below the nearest wall.
HWI: Rejection at wall ↑: price wicked into the wall above and closed back below.
HWI: Bounce at wall ↓: price wicked into the wall below and closed back above.
Chart markers: ▲ break up, ▼ break down, ✖ rejection and bounce.
Limitations (please read)
Walls are calculated on the last bar only. The indicator does not keep a history of where walls were on past bars.
Because of this, break/rejection signals and alerts only work on live (realtime) bars. They will not appear on historical bars, and this is not a bug.
Auto walls (volume and pivot) shift as the lookback window rolls forward and as new data arrives.
Manual options levels are only as accurate as the data you type in.
Flow bias and regime are proxies, not real dealer positioning or order-flow data.
Results vary by symbol, timeframe and data feed.
READ FIRST: Disclaimer
HWI is designed for FUTURES markets with real futures volume (for example ES/MES, NQ/MNQ, YM, RTY, GC, CL, and CME crypto futures). It is built around futures price levels and futures-style volume.
Do NOT rely on it on CFDs, spot forex or spot crypto. Their volume is usually tick volume or broker-specific, not real centralized volume. This distorts the volume profile, the volume walls, POC/VAH/VAL and the flow bias. Options-derived levels (Call Wall, Put Wall, Gamma Flip, Max Pain) also carry a basis difference between spot and futures, so they will not line up correctly.
This is NOT a holy grail. It does not predict price, it does not give guaranteed entries or exits, and it is not a complete trading system. It is a map of key levels and context that you combine with your own strategy, risk management and confirmation.
TradingView has no options-chain feed. The options levels are manual inputs that you type in from a data provider (SpotGamma, Barchart, etc.). The indicator does not verify or calculate them.
Nothing here is financial advice. Trading involves substantial risk of loss. Backtest and forward-test before using real money.
Manual options walls: Call Wall, Put Wall, Gamma Flip, Max Pain
Automatic volume walls: high-volume nodes (HVN) from a volume profile, plus POC / VAH / VAL
Automatic pivot liquidity clusters: levels rejected repeatedly
Strike grid: round-number strikes that often act as magnets
Confluence (★), nearest-wall tracking, ATR distance, flow bias, regime proxy, dashboard and alerts
⚙️ How it works
1) Volume walls (auto)
The script builds a volume profile over the last N bars (default 300) split into rows (default 48). Each bar’s volume is spread across the rows its high-low range touched. A row becomes a wall when it is a local peak and its volume exceeds the average row volume × the HVN threshold (default 1.6×).
Walls above price are drawn red (R, resistance). Walls below price are drawn green (S, support).
The label shows the price and strength (for example ×2.4 means 2.4× average row volume).
It also plots POC (highest-volume price), VAH and VAL (a 70% value area), and an optional profile histogram on the right.
If a symbol has no volume data, it falls back to time-at-price.
2) Pivot liquidity clusters (auto)
Pivot highs and lows are stored and grouped when they fall within a tolerance (default 0.35 × ATR). A cluster needs a minimum number of touches (default 3). The label P×4 means four pivots clustered at that price. These are levels the market has repeatedly respected.
3) Manual options walls
Enter values in the settings. A value of 0 turns that level off.
Call Wall: strike with the largest call open interest or gamma (resistance).
Put Wall: strike with the largest put open interest or gamma (support).
Gamma Flip: above it, dealers are typically long gamma (moves dampen, mean reversion). Below it, they are short gamma (moves can amplify).
Max Pain: strike where option holders lose the most, often a magnet near expiry.
4) Strike grid
Dotted lines at round-number strikes above and below price. The step is automatic (based on price) or user-defined.
5) Confluence ★
When a volume wall lines up with a pivot cluster, the wall gets a ★ and a thicker line. These are the highest-priority levels on the chart.
6) Flow bias
A close-location-value delta proxy, averaged over a set length and shown from -100% to +100%. It estimates buy or sell pressure from where each bar closes within its range. It is not true order flow or footprint data.
7) Regime
If Gamma Flip is set: price above it shows Positive Γ (pin / mean-revert) and price below it shows Negative Γ (expand / momentum).
If not set: it falls back to an ATR compression / expansion proxy.
How to use it (step by step)
Use a futures chart with real volume (for example ES1!, NQ1!, GC1!, CL1!) on a 5m to 1h timeframe for intraday, or 4h to D for swing context.
Enter your options levels (Call Wall, Put Wall, Gamma Flip, Max Pain) in the settings from your data provider. Update them every day or whenever the data changes. The lines are static horizontals and do not update themselves.
Match the futures price. If your options data is quoted for the index or ETF (SPX, SPY, QQQ), convert it to the futures price (add the basis) before typing it in. A wrong basis is the most common reason levels look off.
Identify high-priority zones. Start with ★ confluence walls and any wall that coincides with a manual options level.
Read the dashboard:
Wall ↑ / Wall ↓: nearest levels and their distance in ATR
Position: where price sits between the two walls (% of range)
Regime and Flow bias: the context
Signal: the current reading
Interpret the Signal field:
Between walls (range): price is far from levels, so range logic is more likely.
Rejection risk at wall ↑ / Bounce risk at wall ↓: price is near a wall with no flow confirmation.
Breakout attempt ↑ / Breakdown attempt ↓: price is near a wall and flow is pushing through it.
Confirm with your own strategy (market structure, order flow, session levels, risk rules) before acting. HWI is context, not a trigger.
Tips for best performance
Keep Lookback large enough to cover the current swing or session, but not so large that old, irrelevant volume dominates.
Raise the HVN threshold (2.0+) for cleaner, fewer walls. Lower it to see more.
Raise Min touches or the Pivot length for stronger, rarer pivot clusters.
Positive-gamma conditions tend to favor fade or mean-reversion logic, and negative-gamma conditions favor momentum logic. Treat this as a bias, not a rule.
Near options expiry (0DTE, weekly, monthly), Max Pain and strike levels tend to matter more.
Combine ★ confluence walls with your own stop placement. A wall is a zone, not an exact tick.
Reduce clutter by turning off the histogram, the grid or the pivot layer.
🔔 Alerts and signals
Alert conditions available:
HWI: Break above wall: price closed above the nearest wall.
HWI: Break below wall: price closed below the nearest wall.
HWI: Rejection at wall ↑: price wicked into the wall above and closed back below.
HWI: Bounce at wall ↓: price wicked into the wall below and closed back above.
Chart markers: ▲ break up, ▼ break down, ✖ rejection and bounce.
Limitations (please read)
Walls are calculated on the last bar only. The indicator does not keep a history of where walls were on past bars.
Because of this, break/rejection signals and alerts only work on live (realtime) bars. They will not appear on historical bars, and this is not a bug.
Auto walls (volume and pivot) shift as the lookback window rolls forward and as new data arrives.
Manual options levels are only as accurate as the data you type in.
Flow bias and regime are proxies, not real dealer positioning or order-flow data.
Results vary by symbol, timeframe and data feed.
READ FIRST: Disclaimer
HWI is designed for FUTURES markets with real futures volume (for example ES/MES, NQ/MNQ, YM, RTY, GC, CL, and CME crypto futures). It is built around futures price levels and futures-style volume.
Do NOT rely on it on CFDs, spot forex or spot crypto. Their volume is usually tick volume or broker-specific, not real centralized volume. This distorts the volume profile, the volume walls, POC/VAH/VAL and the flow bias. Options-derived levels (Call Wall, Put Wall, Gamma Flip, Max Pain) also carry a basis difference between spot and futures, so they will not line up correctly.
This is NOT a holy grail. It does not predict price, it does not give guaranteed entries or exits, and it is not a complete trading system. It is a map of key levels and context that you combine with your own strategy, risk management and confirmation.
TradingView has no options-chain feed. The options levels are manual inputs that you type in from a data provider (SpotGamma, Barchart, etc.). The indicator does not verify or calculate them.
Nothing here is financial advice. Trading involves substantial risk of loss. Backtest and forward-test before using real money.

คำจำกัดสิทธิ์ความรับผิดชอบ
ข้อมูลและบทความไม่ได้มีวัตถุประสงค์เพื่อก่อให้เกิดกิจกรรมทางการเงิน, การลงทุน, การซื้อขาย, ข้อเสนอแนะ หรือคำแนะนำประเภทอื่น ๆ ที่ให้หรือรับรองโดย TradingView อ่านเพิ่มเติมใน ข้อกำหนดการใช้งาน
คำจำกัดสิทธิ์ความรับผิดชอบ
ข้อมูลและบทความไม่ได้มีวัตถุประสงค์เพื่อก่อให้เกิดกิจกรรมทางการเงิน, การลงทุน, การซื้อขาย, ข้อเสนอแนะ หรือคำแนะนำประเภทอื่น ๆ ที่ให้หรือรับรองโดย TradingView อ่านเพิ่มเติมใน ข้อกำหนดการใช้งาน