IB Sessions: NY / London / Overnight
IB Sessions: NY / London / Overnight
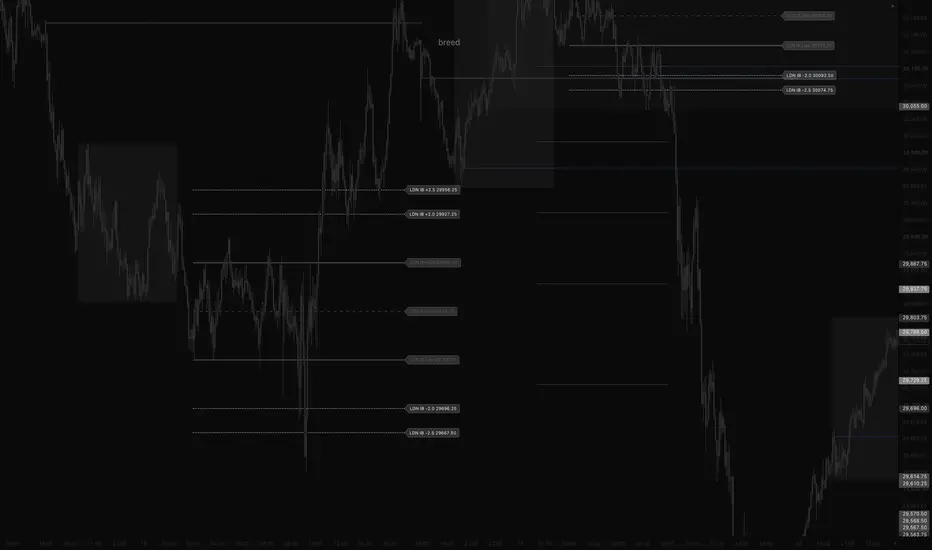
Plots the Initial Balance (IB) for up to three sessions each day, with its midpoint and optional standard-deviation projections.
WHAT IT PLOTS
- IB High and IB Low: the highest and lowest price during each IB period.
- IB Mid: the 50% point of the range (dashed).
- Deviations (optional): projections measured from a leg anchored at the IB high (1) to the IB mid (0).
Price = Mid + k × (High − Mid)
Default levels: −2, −2.5 (below) and +2, +2.5 (above).
±2 sits half an IB range beyond the high/low (the classic 1.5× IB extension); ±3 would be one full range beyond (2× IB).
SESSIONS (New York time, all editable)
- New York IB: 09:30–10:30, levels drawn until 16:00
- London IB: 03:00–04:00, levels drawn until 16:00
- Overnight (Globex) IB: 18:00–19:00, levels drawn until 09:30 the next morning
Each session can be switched on or off and has its own colour.
HOW IT WORKS
- The high, low and mid update live while each IB is forming.
- Deviation levels are added once the IB period closes and the range is final.
- Previous days stay on the chart (10 by default, up to 20 per session).
SETTINGS
- IB period, end time, colour and on/off for each session
- Four editable deviation values, with their own colour
- Width and line style for high/low, mid and deviations
- Label toggle, size and background transparency
NOTES
- Use on timeframes of 30 minutes or lower so the IB boundaries line up with bars.
- Times are in New York time by default; change the timezone setting for other markets.
- With all three sessions and deviations on, the chart can get busy: switch off what you don't need.
This script is for educational purposes and is not financial advice.
Plots the Initial Balance (IB) for up to three sessions each day, with its midpoint and optional standard-deviation projections.
WHAT IT PLOTS
- IB High and IB Low: the highest and lowest price during each IB period.
- IB Mid: the 50% point of the range (dashed).
- Deviations (optional): projections measured from a leg anchored at the IB high (1) to the IB mid (0).
Price = Mid + k × (High − Mid)
Default levels: −2, −2.5 (below) and +2, +2.5 (above).
±2 sits half an IB range beyond the high/low (the classic 1.5× IB extension); ±3 would be one full range beyond (2× IB).
SESSIONS (New York time, all editable)
- New York IB: 09:30–10:30, levels drawn until 16:00
- London IB: 03:00–04:00, levels drawn until 16:00
- Overnight (Globex) IB: 18:00–19:00, levels drawn until 09:30 the next morning
Each session can be switched on or off and has its own colour.
HOW IT WORKS
- The high, low and mid update live while each IB is forming.
- Deviation levels are added once the IB period closes and the range is final.
- Previous days stay on the chart (10 by default, up to 20 per session).
SETTINGS
- IB period, end time, colour and on/off for each session
- Four editable deviation values, with their own colour
- Width and line style for high/low, mid and deviations
- Label toggle, size and background transparency
NOTES
- Use on timeframes of 30 minutes or lower so the IB boundaries line up with bars.
- Times are in New York time by default; change the timezone setting for other markets.
- With all three sessions and deviations on, the chart can get busy: switch off what you don't need.
This script is for educational purposes and is not financial advice.

คำจำกัดสิทธิ์ความรับผิดชอบ
ข้อมูลและบทความไม่ได้มีวัตถุประสงค์เพื่อก่อให้เกิดกิจกรรมทางการเงิน, การลงทุน, การซื้อขาย, ข้อเสนอแนะ หรือคำแนะนำประเภทอื่น ๆ ที่ให้หรือรับรองโดย TradingView อ่านเพิ่มเติมใน ข้อกำหนดการใช้งาน
คำจำกัดสิทธิ์ความรับผิดชอบ
ข้อมูลและบทความไม่ได้มีวัตถุประสงค์เพื่อก่อให้เกิดกิจกรรมทางการเงิน, การลงทุน, การซื้อขาย, ข้อเสนอแนะ หรือคำแนะนำประเภทอื่น ๆ ที่ให้หรือรับรองโดย TradingView อ่านเพิ่มเติมใน ข้อกำหนดการใช้งาน