TDT Time Dilation | Sattam
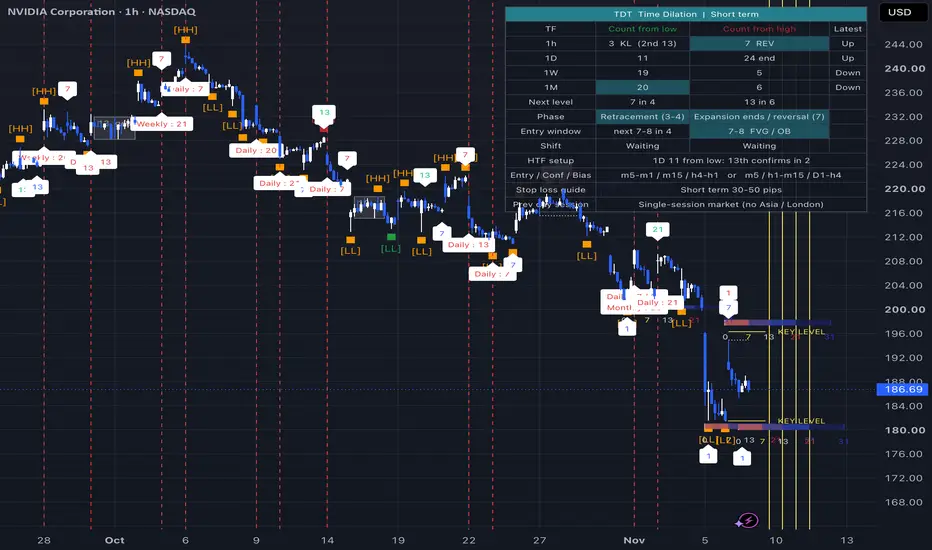
TDT Time Dilation is an open-source candle counting tool for the Time Dilation Theory (TDT) method. It counts candles from swing highs and lows, draws the count as a time strip with the method's numbers, marks the candles where the count reaches 7, 13, 21 and 31, and lines the counts of the chart up with the counts of higher timeframes. It is a time tool: it does not draw price targets and does not give buy or sell signals.
WHAT IT DOES
1. Counting from highs and lows
Every lower low ([LL], a Bill Williams bottom fractal below the previous bottom fractal) starts a bullish count, and every higher high ([HH]) starts a bearish count. The count follows the strict counting rule of the method: candle 1 is the extreme candle when it closes in the direction of the count, otherwise the first candle after it that does. Bearish closed candles are ignored when a bullish count starts, bullish closed candles when a bearish count starts, and doji candles are counted for both sides.
2. When a count starts again
A running count is kept until price makes a new extreme beyond it, or until the count passes the end of the cycle (21 by default, the number where the cycle ends most of the time). Optionally a count also starts again from a clear reversal: a swing that lands on 7, 13 or 21 of the running count and is the extreme of that leg starts a count in the other direction.
3. Consolidations (time distortion)
A consolidation is a group of candles (10 by default) whose total range is small compared with ATR(14). It is drawn as a grey box with its length; 7 or 13 candles are labelled as a gear change. The candle that leaves the box in the breakout direction is candle 1 of a new expansion count, and highs or lows inside the box never start a count. As an option, consolidation candles can be left out of every running count.
4. Time strip and time lines
Each count is drawn as a strip that starts at candle 0 with the levels 0, 7, 13, 21 and 31 (4 and 17 can be switched on). Vertical lines mark 13 and 21 of the latest count. The levels can also follow the TDT sequences: Basic 1-3-7-13-17-21-31, Reversal 1-3-7-13-21-31, 2nd 1-5-9-17-25-37 and Perfect 1-3-6-9-15-24-39. Optional Fib time zone lines and a 90th candle line are available.
5. Count numbers on turning points
Swings that land on 7, 13, 21 or 31 of a running count get a small boxed number, and candle 1 of each count is marked with "1". The other sequence numbers (3, 4, 5, 9, 11, 17, 20, 25) each have their own switch. By default only the most recent count is numbered; numbers can also be limited to the count that agrees with the direction of a higher timeframe count.
6. Multi-timeframe time alignment
The same counting engine runs on up to three higher timeframes. In Auto mode they follow the TDT pairing (H1 for 1m and 5m, H4 for 5m and 15m, D1 for 15m and H1, W1 for H4 and D1, M1 for D1 and W1). When a higher timeframe candle opens on a key number (7, 13, 20, 21 by default) a dashed line and a tag such as "Daily : 13" are drawn, and a callout shows when the chart count and a higher timeframe count are on key numbers at the same time.
7. Dashboard
For the chart and each higher timeframe: the count from the last low and from the last high, and the direction of the most recent count. Below it: the next time level, the market phase read from the count (retracement 3-4, expansion 4-7, reversal 7, 13, 21, or the consolidation in progress), the entry window of the method (7-8, 12-13, 20-21, 31-34, 40-42, 90), the structure shift of the count, the higher timeframe setup (7-9 retracement or continuation after 13), the entry / confirmation / bias timeframes, a stop loss guide by trade type, and the session that made the previous day high and low.
HOW TO USE
Start with the higher timeframes in the dashboard to see where their counts are and which way the latest count points. Then watch the chart count: the strip shows how many candles remain to 7, 13, 21 and 31, and the boxed numbers show which past turning points landed on those numbers. Times when the chart count and a higher timeframe count reach key numbers together are marked by callouts and tags. The entry window row only names the entry type used by the method (for example FVG / OB or turtle soup); the indicator does not detect those patterns, so confirm them with your own price analysis.
SETTINGS
Counting: fractal strength, doji size, cycle end, time levels set, reversal restarts and calculation depth.
Consolidation: length, maximum range in ATR and the boxes.
Gann box template levels and strip style: the seven level slots with their colors, strip height, gap and fill.
Time lines: reversal time lines, Fib time zone and the 90th candle.
Fractals and key levels: [HH] / [LL] markers, the previous higher timeframe high / low as key level, and the structure shift line.
TDT types: style of the numbers, which counts are numbered, the trend filter and a switch for each number.
Time alignment: Auto or Manual higher timeframes, key numbers and tolerance.
Extras: All, None or one of: skip consolidation candles in counts, third higher timeframe, higher timeframe count lines and tags, second count per side, previous day session.
All settings and tooltips are in English and Arabic.
ALERTS
New count, count on an alert number (7, 13, 21 by default), entry window opened, time alignment, and higher timeframe setup (7th or 13th candle).
WHAT IS ORIGINAL
The script is written from scratch as one counting engine that applies the strict counting rule, consolidation expansions, reversal restarts and cycle end in the same way on the chart and on every higher timeframe, so the dashboard, strips, numbers and callouts always use the same count. Counts are computed only on confirmed candles and higher timeframe values come from closed higher timeframe candles.
LIMITATIONS AND DRAWING BEHAVIOR
- Fractals are confirmed two candles after the high or low (with the default strength), so [HH] / [LL] markers, strips and numbers appear two candles late and are drawn back on the extreme candle.
- When the extreme candle closes against the count, the count waits for the first candle that closes with it, so its strip appears when that candle closes.
- Future strip levels are projected in time; with "skip consolidation candles" they move right if a new consolidation forms.
- Older strips, numbers and tags are removed when the drawing limits are reached; only the latest strips of each side are kept.
- Counting starts at a fixed depth before the last bar (5000 bars by default) so results do not change with loaded history; higher timeframes with few bars on a low chart timeframe may show short or empty counts.
- Consolidations are detected with a range rule (10 candles within 2 x ATR by default) because the method does not give a numeric definition; the session row uses New York hours and is not used for markets with a single exchange session.
- The method's numbers describe time windows to watch; they are not forecasts and do not guarantee a reversal.
This script is for education and analysis only and is not financial advice.
-----------------------------------------------------------------
مؤشر TDT Time Dilation أداة مفتوحة المصدر لعدّ الشموع وفق منهج نظرية تمدد الزمن (Time Dilation Theory). يعدّ الشموع من القمم والقيعان، ويرسم العدّ شريطاً زمنياً بأرقام المنهج، ويُعلّم الشموع التي يبلغ فيها العدّ 7 و13 و21 و31، ويوائم عدّ الشارت مع عدّ الفريمات الأعلى. هو أداة زمن: لا يرسم أهدافاً سعرية ولا يعطي إشارات شراء أو بيع.
ماذا يفعل
1. العدّ من القمم والقيعان
كل قاع أدنى ([LL]، فراكتل بيل ويليامز أدنى من القاع السابق) يبدأ عدّاً صاعداً، وكل قمة أعلى ([HH]) تبدأ عدّاً هابطاً. العدّ يتبع القاعدة الصارمة في المنهج: الشمعة 1 هي شمعة الطرف إن أغلقت في اتجاه العدّ، وإلا فأول شمعة بعدها تغلق في اتجاهه. تُتجاهل الشمعة الهابطة عند بدء العدّ الصاعد، والصاعدة عند بدء العدّ الهابط، وشمعة الدوجي تُعدّ للجهتين.
2. متى يبدأ العدّ من جديد
يستمر العدّ حتى يصنع السعر طرفاً أبعد منه، أو يتجاوز العدّ نهاية الدورة (21 افتراضياً، وهو الرقم الذي تنتهي عنده الدورة غالباً). ويمكن أيضاً أن يبدأ العدّ من انعكاس واضح: قمة أو قاع يقع على 7 أو 13 أو 21 من العدّ الجاري، وهو طرف تلك الموجة، يبدأ عدّاً في الاتجاه المعاكس.
3. التجميع (تشويه الزمن)
التجميع مجموعة شموع (10 افتراضياً) مداها الكلي صغير مقارنة بـATR(14). يُرسم صندوقاً رمادياً بطوله، ويُكتب «gear change» إذا كان 7 أو 13 شمعة. الشمعة التي تخرج من الصندوق في اتجاه الخروج هي الشمعة 1 لعدّ توسع جديد، والقمم والقيعان داخل الصندوق لا تبدأ عدّاً. ويمكن اختيارياً طرح شموع التجميع من كل عدّ جارٍ.
4. الشريط الزمني وخطوط الزمن
كل عدّ يُرسم شريطاً يبدأ من الشمعة 0 بمستويات 0 و7 و13 و21 و31 (ويمكن تفعيل 4 و17). خطوط عمودية تُعلّم 13 و21 لآخر عدّ. ويمكن أن تتبع المستويات متتاليات TDT: الأساسية 1-3-7-13-17-21-31، والانعكاس 1-3-7-13-21-31، والثانية 1-5-9-17-25-37، والمثالية 1-3-6-9-15-24-39. وتتوفر اختيارياً مناطق فيبو الزمنية وخط الشمعة 90.
5. أرقام العدّ على نقاط الانعكاس
القمم والقيعان التي تقع على 7 أو 13 أو 21 أو 31 من عدّ جارٍ يُكتب عليها رقم في صندوق صغير، وتُعلَّم الشمعة 1 لكل عدّ بـ«1». أرقام المتتاليات الأخرى (3، 4، 5، 9، 11، 17، 20، 25) لكل منها خانة تفعيل. افتراضياً يُرقَّم العدّ الأحدث فقط، ويمكن قصر الأرقام على العدّ الموافق لاتجاه عدّ الفريم الأعلى.
6. توافق الزمن بين الفريمات
نفس محرك العدّ يعمل على حتى ثلاثة فريمات أعلى. في الوضع التلقائي تتبع أزواج TDT (H1 لـ1m و5m، وH4 لـ5m و15m، وD1 لـ15m وH1، وW1 لـH4 وD1، وM1 لـD1 وW1). حين تفتح شمعة الفريم الأعلى على رقم مفتاحي (7 و13 و20 و21 افتراضياً) يُرسم خط متقطع ووسم مثل «Daily : 13»، وتظهر فقاعة حين يكون عدّ الشارت وعدّ فريم أعلى على أرقام مفتاحية في الوقت نفسه.
7. اللوحة
للشارت ولكل فريم أعلى: العدّ من آخر قاع ومن آخر قمة، واتجاه آخر عدّ. وتحتها: مستوى الزمن التالي، ومرحلة السوق من العدّ (تصحيح 3-4، توسع 4-7، انعكاس 7 و13 و21، أو التجميع الجاري)، ونافذة الدخول في المنهج (7-8، 12-13، 20-21، 31-34، 40-42، 90)، وتحوّل الهيكل للعدّ، وإعداد الفريم الأعلى (تصحيح 7-9 أو استمرار بعد 13)، وفريمات الدخول والتأكيد والاتجاه، ودليل وقف الخسارة حسب نوع التداول، والجلسة التي صنعت قمة وقاع اليوم السابق.
طريقة الاستخدام
ابدأ بالفريمات الأعلى في اللوحة لترى أين وصل عدّها وإلى أين يشير آخر عدّ. ثم راقب عدّ الشارت: الشريط يبيّن كم شمعة بقيت إلى 7 و13 و21 و31، والأرقام في الصناديق تبيّن نقاط الانعكاس السابقة التي وقعت على هذه الأرقام. الأوقات التي يبلغ فيها عدّ الشارت وعدّ فريم أعلى أرقاماً مفتاحية معاً تُعلَّم بالفقاعات والوسوم. سطر نافذة الدخول يذكر فقط نوع الدخول في المنهج (مثل FVG / OB أو Turtle Soup)، والمؤشر لا يكشف هذه النماذج، فأكّدها بتحليلك للسعر.
الإعدادات
العدّ: قوة الفراكتل، وحجم الدوجي، ونهاية الدورة، ومجموعة مستويات الزمن، والعدّ من الانعكاسات، وعمق الحساب.
التجميع: الطول، وأقصى مدى بالـATR، والصناديق.
مستويات قالب صندوق جان وشكل الشريط: خانات المستويات السبع بألوانها، وارتفاع الشريط، والمسافة، والتعبئة.
خطوط الزمن: خطوط زمن الانعكاس، ومناطق فيبو الزمنية، والشمعة 90.
الفراكتل والمستويات المهمة: علامات [HH] / [LL]، وقمة وقاع الفريم الأعلى السابق كمستوى مهم، وخط تحوّل الهيكل.
أنواع TDT: شكل الأرقام، والأعداد المرقّمة، وفلتر الاتجاه، وخانة لكل رقم.
توافق الزمن: الفريمات الأعلى تلقائياً أو يدوياً، والأرقام المفتاحية، والسماحية.
الإضافات: الكل، أو لا شيء، أو واحدة من: طرح شموع التجميع من العدّ، فريم أعلى ثالث، خطوط ووسوم عدّ الفريم الأعلى، عدّ ثانٍ لكل اتجاه، جلسة قمة وقاع اليوم السابق.
كل الإعدادات والتلميحات بالعربي والإنجليزي.
التنبيهات
بدء عدّ جديد، وبلوغ العدّ رقم تنبيه (7 و13 و21 افتراضياً)، وفتح نافذة دخول، وتوافق الزمن، وإعداد الفريم الأعلى (الشمعة 7 أو 13).
ما الأصلي فيه
السكربت مكتوب من الصفر كمحرك عدّ واحد يطبّق القاعدة الصارمة وعدّ التوسع من التجميع والعدّ من الانعكاس ونهاية الدورة بالطريقة نفسها على الشارت وعلى كل فريم أعلى، فاللوحة والأشرطة والأرقام والفقاعات تستخدم العدّ نفسه دائماً. العدّ يُحسب على الشموع المغلقة فقط، وقيم الفريمات الأعلى من شموعها المغلقة.
الحدود وسلوك الرسم
- الفراكتل يتأكد بعد القمة أو القاع بشمعتين (بالقوة الافتراضية)، فتظهر علامات [HH] / [LL] والأشرطة والأرقام متأخرة شمعتين وتُرسم للخلف على شمعة الطرف.
- إذا أغلقت شمعة الطرف عكس العدّ، ينتظر العدّ أول شمعة تغلق معه، فيظهر شريطه عند إغلاق تلك الشمعة.
- مستويات الشريط القادمة مسقطة زمنياً، ومع «طرح شموع التجميع» تتحرك يميناً إذا تكوّن تجميع جديد.
- الأشرطة والأرقام والوسوم القديمة تُحذف عند بلوغ حدود الرسم، ويبقى آخر الأشرطة لكل اتجاه.
- العدّ يبدأ من عمق ثابت قبل آخر شمعة (5000 شمعة افتراضياً) فلا تتغير النتائج مع كمية التاريخ المحمّل، والفريمات الأعلى قليلة الشموع على شارت صغير قد تُظهر عدّاً قصيراً أو فارغاً.
- التجميع يُكشف بقاعدة مدى (10 شموع ضمن 2 × ATR افتراضياً) لأن المنهج لا يعطي تعريفاً رقمياً، وسطر الجلسة يستخدم ساعات نيويورك ولا يُستخدم للأسواق ذات جلسة تداول واحدة.
- أرقام المنهج نوافذ زمنية للمراقبة، وليست تنبؤات ولا تضمن الانعكاس.
هذا السكربت للتعليم والتحليل فقط، وليس نصيحة مالية.
WHAT IT DOES
1. Counting from highs and lows
Every lower low ([LL], a Bill Williams bottom fractal below the previous bottom fractal) starts a bullish count, and every higher high ([HH]) starts a bearish count. The count follows the strict counting rule of the method: candle 1 is the extreme candle when it closes in the direction of the count, otherwise the first candle after it that does. Bearish closed candles are ignored when a bullish count starts, bullish closed candles when a bearish count starts, and doji candles are counted for both sides.
2. When a count starts again
A running count is kept until price makes a new extreme beyond it, or until the count passes the end of the cycle (21 by default, the number where the cycle ends most of the time). Optionally a count also starts again from a clear reversal: a swing that lands on 7, 13 or 21 of the running count and is the extreme of that leg starts a count in the other direction.
3. Consolidations (time distortion)
A consolidation is a group of candles (10 by default) whose total range is small compared with ATR(14). It is drawn as a grey box with its length; 7 or 13 candles are labelled as a gear change. The candle that leaves the box in the breakout direction is candle 1 of a new expansion count, and highs or lows inside the box never start a count. As an option, consolidation candles can be left out of every running count.
4. Time strip and time lines
Each count is drawn as a strip that starts at candle 0 with the levels 0, 7, 13, 21 and 31 (4 and 17 can be switched on). Vertical lines mark 13 and 21 of the latest count. The levels can also follow the TDT sequences: Basic 1-3-7-13-17-21-31, Reversal 1-3-7-13-21-31, 2nd 1-5-9-17-25-37 and Perfect 1-3-6-9-15-24-39. Optional Fib time zone lines and a 90th candle line are available.
5. Count numbers on turning points
Swings that land on 7, 13, 21 or 31 of a running count get a small boxed number, and candle 1 of each count is marked with "1". The other sequence numbers (3, 4, 5, 9, 11, 17, 20, 25) each have their own switch. By default only the most recent count is numbered; numbers can also be limited to the count that agrees with the direction of a higher timeframe count.
6. Multi-timeframe time alignment
The same counting engine runs on up to three higher timeframes. In Auto mode they follow the TDT pairing (H1 for 1m and 5m, H4 for 5m and 15m, D1 for 15m and H1, W1 for H4 and D1, M1 for D1 and W1). When a higher timeframe candle opens on a key number (7, 13, 20, 21 by default) a dashed line and a tag such as "Daily : 13" are drawn, and a callout shows when the chart count and a higher timeframe count are on key numbers at the same time.
7. Dashboard
For the chart and each higher timeframe: the count from the last low and from the last high, and the direction of the most recent count. Below it: the next time level, the market phase read from the count (retracement 3-4, expansion 4-7, reversal 7, 13, 21, or the consolidation in progress), the entry window of the method (7-8, 12-13, 20-21, 31-34, 40-42, 90), the structure shift of the count, the higher timeframe setup (7-9 retracement or continuation after 13), the entry / confirmation / bias timeframes, a stop loss guide by trade type, and the session that made the previous day high and low.
HOW TO USE
Start with the higher timeframes in the dashboard to see where their counts are and which way the latest count points. Then watch the chart count: the strip shows how many candles remain to 7, 13, 21 and 31, and the boxed numbers show which past turning points landed on those numbers. Times when the chart count and a higher timeframe count reach key numbers together are marked by callouts and tags. The entry window row only names the entry type used by the method (for example FVG / OB or turtle soup); the indicator does not detect those patterns, so confirm them with your own price analysis.
SETTINGS
Counting: fractal strength, doji size, cycle end, time levels set, reversal restarts and calculation depth.
Consolidation: length, maximum range in ATR and the boxes.
Gann box template levels and strip style: the seven level slots with their colors, strip height, gap and fill.
Time lines: reversal time lines, Fib time zone and the 90th candle.
Fractals and key levels: [HH] / [LL] markers, the previous higher timeframe high / low as key level, and the structure shift line.
TDT types: style of the numbers, which counts are numbered, the trend filter and a switch for each number.
Time alignment: Auto or Manual higher timeframes, key numbers and tolerance.
Extras: All, None or one of: skip consolidation candles in counts, third higher timeframe, higher timeframe count lines and tags, second count per side, previous day session.
All settings and tooltips are in English and Arabic.
ALERTS
New count, count on an alert number (7, 13, 21 by default), entry window opened, time alignment, and higher timeframe setup (7th or 13th candle).
WHAT IS ORIGINAL
The script is written from scratch as one counting engine that applies the strict counting rule, consolidation expansions, reversal restarts and cycle end in the same way on the chart and on every higher timeframe, so the dashboard, strips, numbers and callouts always use the same count. Counts are computed only on confirmed candles and higher timeframe values come from closed higher timeframe candles.
LIMITATIONS AND DRAWING BEHAVIOR
- Fractals are confirmed two candles after the high or low (with the default strength), so [HH] / [LL] markers, strips and numbers appear two candles late and are drawn back on the extreme candle.
- When the extreme candle closes against the count, the count waits for the first candle that closes with it, so its strip appears when that candle closes.
- Future strip levels are projected in time; with "skip consolidation candles" they move right if a new consolidation forms.
- Older strips, numbers and tags are removed when the drawing limits are reached; only the latest strips of each side are kept.
- Counting starts at a fixed depth before the last bar (5000 bars by default) so results do not change with loaded history; higher timeframes with few bars on a low chart timeframe may show short or empty counts.
- Consolidations are detected with a range rule (10 candles within 2 x ATR by default) because the method does not give a numeric definition; the session row uses New York hours and is not used for markets with a single exchange session.
- The method's numbers describe time windows to watch; they are not forecasts and do not guarantee a reversal.
This script is for education and analysis only and is not financial advice.
-----------------------------------------------------------------
مؤشر TDT Time Dilation أداة مفتوحة المصدر لعدّ الشموع وفق منهج نظرية تمدد الزمن (Time Dilation Theory). يعدّ الشموع من القمم والقيعان، ويرسم العدّ شريطاً زمنياً بأرقام المنهج، ويُعلّم الشموع التي يبلغ فيها العدّ 7 و13 و21 و31، ويوائم عدّ الشارت مع عدّ الفريمات الأعلى. هو أداة زمن: لا يرسم أهدافاً سعرية ولا يعطي إشارات شراء أو بيع.
ماذا يفعل
1. العدّ من القمم والقيعان
كل قاع أدنى ([LL]، فراكتل بيل ويليامز أدنى من القاع السابق) يبدأ عدّاً صاعداً، وكل قمة أعلى ([HH]) تبدأ عدّاً هابطاً. العدّ يتبع القاعدة الصارمة في المنهج: الشمعة 1 هي شمعة الطرف إن أغلقت في اتجاه العدّ، وإلا فأول شمعة بعدها تغلق في اتجاهه. تُتجاهل الشمعة الهابطة عند بدء العدّ الصاعد، والصاعدة عند بدء العدّ الهابط، وشمعة الدوجي تُعدّ للجهتين.
2. متى يبدأ العدّ من جديد
يستمر العدّ حتى يصنع السعر طرفاً أبعد منه، أو يتجاوز العدّ نهاية الدورة (21 افتراضياً، وهو الرقم الذي تنتهي عنده الدورة غالباً). ويمكن أيضاً أن يبدأ العدّ من انعكاس واضح: قمة أو قاع يقع على 7 أو 13 أو 21 من العدّ الجاري، وهو طرف تلك الموجة، يبدأ عدّاً في الاتجاه المعاكس.
3. التجميع (تشويه الزمن)
التجميع مجموعة شموع (10 افتراضياً) مداها الكلي صغير مقارنة بـATR(14). يُرسم صندوقاً رمادياً بطوله، ويُكتب «gear change» إذا كان 7 أو 13 شمعة. الشمعة التي تخرج من الصندوق في اتجاه الخروج هي الشمعة 1 لعدّ توسع جديد، والقمم والقيعان داخل الصندوق لا تبدأ عدّاً. ويمكن اختيارياً طرح شموع التجميع من كل عدّ جارٍ.
4. الشريط الزمني وخطوط الزمن
كل عدّ يُرسم شريطاً يبدأ من الشمعة 0 بمستويات 0 و7 و13 و21 و31 (ويمكن تفعيل 4 و17). خطوط عمودية تُعلّم 13 و21 لآخر عدّ. ويمكن أن تتبع المستويات متتاليات TDT: الأساسية 1-3-7-13-17-21-31، والانعكاس 1-3-7-13-21-31، والثانية 1-5-9-17-25-37، والمثالية 1-3-6-9-15-24-39. وتتوفر اختيارياً مناطق فيبو الزمنية وخط الشمعة 90.
5. أرقام العدّ على نقاط الانعكاس
القمم والقيعان التي تقع على 7 أو 13 أو 21 أو 31 من عدّ جارٍ يُكتب عليها رقم في صندوق صغير، وتُعلَّم الشمعة 1 لكل عدّ بـ«1». أرقام المتتاليات الأخرى (3، 4، 5، 9، 11، 17، 20، 25) لكل منها خانة تفعيل. افتراضياً يُرقَّم العدّ الأحدث فقط، ويمكن قصر الأرقام على العدّ الموافق لاتجاه عدّ الفريم الأعلى.
6. توافق الزمن بين الفريمات
نفس محرك العدّ يعمل على حتى ثلاثة فريمات أعلى. في الوضع التلقائي تتبع أزواج TDT (H1 لـ1m و5m، وH4 لـ5m و15m، وD1 لـ15m وH1، وW1 لـH4 وD1، وM1 لـD1 وW1). حين تفتح شمعة الفريم الأعلى على رقم مفتاحي (7 و13 و20 و21 افتراضياً) يُرسم خط متقطع ووسم مثل «Daily : 13»، وتظهر فقاعة حين يكون عدّ الشارت وعدّ فريم أعلى على أرقام مفتاحية في الوقت نفسه.
7. اللوحة
للشارت ولكل فريم أعلى: العدّ من آخر قاع ومن آخر قمة، واتجاه آخر عدّ. وتحتها: مستوى الزمن التالي، ومرحلة السوق من العدّ (تصحيح 3-4، توسع 4-7، انعكاس 7 و13 و21، أو التجميع الجاري)، ونافذة الدخول في المنهج (7-8، 12-13، 20-21، 31-34، 40-42، 90)، وتحوّل الهيكل للعدّ، وإعداد الفريم الأعلى (تصحيح 7-9 أو استمرار بعد 13)، وفريمات الدخول والتأكيد والاتجاه، ودليل وقف الخسارة حسب نوع التداول، والجلسة التي صنعت قمة وقاع اليوم السابق.
طريقة الاستخدام
ابدأ بالفريمات الأعلى في اللوحة لترى أين وصل عدّها وإلى أين يشير آخر عدّ. ثم راقب عدّ الشارت: الشريط يبيّن كم شمعة بقيت إلى 7 و13 و21 و31، والأرقام في الصناديق تبيّن نقاط الانعكاس السابقة التي وقعت على هذه الأرقام. الأوقات التي يبلغ فيها عدّ الشارت وعدّ فريم أعلى أرقاماً مفتاحية معاً تُعلَّم بالفقاعات والوسوم. سطر نافذة الدخول يذكر فقط نوع الدخول في المنهج (مثل FVG / OB أو Turtle Soup)، والمؤشر لا يكشف هذه النماذج، فأكّدها بتحليلك للسعر.
الإعدادات
العدّ: قوة الفراكتل، وحجم الدوجي، ونهاية الدورة، ومجموعة مستويات الزمن، والعدّ من الانعكاسات، وعمق الحساب.
التجميع: الطول، وأقصى مدى بالـATR، والصناديق.
مستويات قالب صندوق جان وشكل الشريط: خانات المستويات السبع بألوانها، وارتفاع الشريط، والمسافة، والتعبئة.
خطوط الزمن: خطوط زمن الانعكاس، ومناطق فيبو الزمنية، والشمعة 90.
الفراكتل والمستويات المهمة: علامات [HH] / [LL]، وقمة وقاع الفريم الأعلى السابق كمستوى مهم، وخط تحوّل الهيكل.
أنواع TDT: شكل الأرقام، والأعداد المرقّمة، وفلتر الاتجاه، وخانة لكل رقم.
توافق الزمن: الفريمات الأعلى تلقائياً أو يدوياً، والأرقام المفتاحية، والسماحية.
الإضافات: الكل، أو لا شيء، أو واحدة من: طرح شموع التجميع من العدّ، فريم أعلى ثالث، خطوط ووسوم عدّ الفريم الأعلى، عدّ ثانٍ لكل اتجاه، جلسة قمة وقاع اليوم السابق.
كل الإعدادات والتلميحات بالعربي والإنجليزي.
التنبيهات
بدء عدّ جديد، وبلوغ العدّ رقم تنبيه (7 و13 و21 افتراضياً)، وفتح نافذة دخول، وتوافق الزمن، وإعداد الفريم الأعلى (الشمعة 7 أو 13).
ما الأصلي فيه
السكربت مكتوب من الصفر كمحرك عدّ واحد يطبّق القاعدة الصارمة وعدّ التوسع من التجميع والعدّ من الانعكاس ونهاية الدورة بالطريقة نفسها على الشارت وعلى كل فريم أعلى، فاللوحة والأشرطة والأرقام والفقاعات تستخدم العدّ نفسه دائماً. العدّ يُحسب على الشموع المغلقة فقط، وقيم الفريمات الأعلى من شموعها المغلقة.
الحدود وسلوك الرسم
- الفراكتل يتأكد بعد القمة أو القاع بشمعتين (بالقوة الافتراضية)، فتظهر علامات [HH] / [LL] والأشرطة والأرقام متأخرة شمعتين وتُرسم للخلف على شمعة الطرف.
- إذا أغلقت شمعة الطرف عكس العدّ، ينتظر العدّ أول شمعة تغلق معه، فيظهر شريطه عند إغلاق تلك الشمعة.
- مستويات الشريط القادمة مسقطة زمنياً، ومع «طرح شموع التجميع» تتحرك يميناً إذا تكوّن تجميع جديد.
- الأشرطة والأرقام والوسوم القديمة تُحذف عند بلوغ حدود الرسم، ويبقى آخر الأشرطة لكل اتجاه.
- العدّ يبدأ من عمق ثابت قبل آخر شمعة (5000 شمعة افتراضياً) فلا تتغير النتائج مع كمية التاريخ المحمّل، والفريمات الأعلى قليلة الشموع على شارت صغير قد تُظهر عدّاً قصيراً أو فارغاً.
- التجميع يُكشف بقاعدة مدى (10 شموع ضمن 2 × ATR افتراضياً) لأن المنهج لا يعطي تعريفاً رقمياً، وسطر الجلسة يستخدم ساعات نيويورك ولا يُستخدم للأسواق ذات جلسة تداول واحدة.
- أرقام المنهج نوافذ زمنية للمراقبة، وليست تنبؤات ولا تضمن الانعكاس.
هذا السكربت للتعليم والتحليل فقط، وليس نصيحة مالية.

คำจำกัดสิทธิ์ความรับผิดชอบ
ข้อมูลและบทความไม่ได้มีวัตถุประสงค์เพื่อก่อให้เกิดกิจกรรมทางการเงิน, การลงทุน, การซื้อขาย, ข้อเสนอแนะ หรือคำแนะนำประเภทอื่น ๆ ที่ให้หรือรับรองโดย TradingView อ่านเพิ่มเติมใน ข้อกำหนดการใช้งาน
คำจำกัดสิทธิ์ความรับผิดชอบ
ข้อมูลและบทความไม่ได้มีวัตถุประสงค์เพื่อก่อให้เกิดกิจกรรมทางการเงิน, การลงทุน, การซื้อขาย, ข้อเสนอแนะ หรือคำแนะนำประเภทอื่น ๆ ที่ให้หรือรับรองโดย TradingView อ่านเพิ่มเติมใน ข้อกำหนดการใช้งาน