ที่อัปเดต:
[blackcat] L1 Dynamic Momentum Indicator
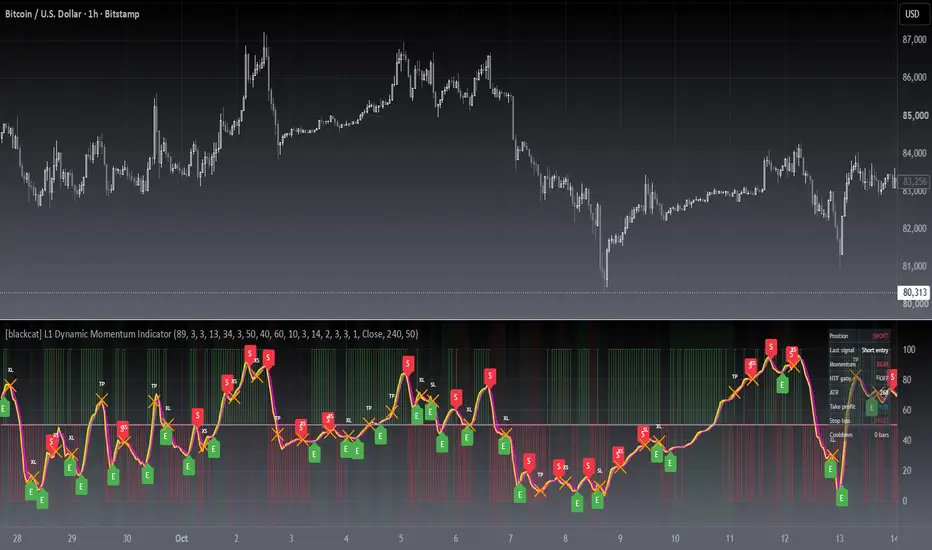
**1. Overview**
"[blackcat] L1 Dynamic Momentum Indicator" is a custom TradingView indicator designed to analyze price momentum and market trends. It combines the calculation methods of Stoch (RSV) and Moving Average (SMA) to provide market overbought and oversold signals.
**2. Calculation Method**
- **RSV Value Calculation**: The RSV value is calculated using the relative relationship between the current price and the lowest and highest prices over the past 89 periods.
- **K Value Calculation**: The calculated RSV value is subjected to a 3-period Simple Moving Average (SMA) to obtain the K value.
- **D Value Calculation**: The K value is subjected to a 3-period Simple Moving Average (SMA) to obtain the D value.
- **Momentum Difference Calculation**: The difference between the 13-period Exponential Moving Average (EMA) and the 34-period EMA of closing prices is calculated, and then the moving average of this difference is calculated.
**3. Indicator Display**
- **K and D Lines**: The moving averages of the K value and D value are displayed on the chart, indicating a strong market condition when the K line is above the D line, and a weak market condition when the K line is below the D line.
- **Threshold Line**: A fixed threshold line of 50 is displayed to distinguish the overbought and oversold areas.
- **Green and Red Bars**: Green and red bars are drawn on the chart based on the relationship between the momentum difference and the average value, indicating the market trend.
**4. Usage Suggestions**
- When the market is in a strong condition, a potential reversal may occur in the overbought area after selling. When the market is in a weak condition, a potential bounce may occur in the oversold area after buying.
- Pay attention to the changes in market trends, with the appearance of green bars may indicate that the market is about to rise, and the appearance of red bars may indicate that the market is about to fall.
**5. Caution**
- The indicator is based on the provided code and may require adjustments based on market conditions.
- The accuracy of the indicator depends on the selection of calculation parameters and the reliability of market data.
Release Note
Correct false settingsRelease Note
OVERVIEWThe [blackcat] L1 Dynamic Momentum Indicator combines elements of relative strength and exponential moving averages to provide a comprehensive view of market momentum. This indicator calculates key values such as Relative Strength Value (RSV), K Value, D Value, and EMA Difference. By plotting these values on the chart, traders can identify potential buy and sell opportunities based on dynamic momentum shifts 📈💹.
FEATURES
Calculates several key momentum indicators:
RSV: Relative Strength Value over a specified lookback period.
K Value: 3-period SMA of the RSV.
D Value: 3-period SMA of the K Value.
EMA Difference: Difference between short-term and long-term EMAs.
EMA Average: 3-period SMA of the EMA Difference.
Plots the following lines on the chart:
Yellow line representing the K Value.
Fuchsia line representing the D Value.
Filled area between K and D Values for visual clarity.
Threshold line at 50 for reference.
Green and red bars indicating bullish and bearish conditions, respectively.
Displays buy ('Buy') and sell ('Sell') labels on the chart for quick identification 🏷️
Generates alerts when K Value crosses above or below the D Value 🔔
HOW TO USE
Add the indicator to your TradingView chart by selecting it from the indicators list.
Observe the plotted K and D Values along with the green and red bars for trend direction.
Monitor the chart for buy and sell labels indicating potential trade opportunities.
Set up alerts based on the generated signals to receive notifications when conditions are met 📲.
Use the threshold line and filled areas for additional context in your analysis.
LIMITATIONS
The indicator may generate false signals in highly volatile or ranging markets 🌪️.
Users should combine this indicator with other forms of analysis for more reliable trading decisions.
The effectiveness of the indicator may vary depending on the asset and timeframe being analyzed.
NOTES
Ensure that you have sufficient historical data available for accurate calculations.
Test the indicator thoroughly on demo accounts before applying it to live trading 🔍.
Customize the appearance and parameters as needed to fit your trading strategy.
Release Note
correct as : indicator('[blackcat] L1 Dynamic Momentum Indicator', overlay=false, max_labels_count = 500)Release Note
█ OVERVIEWL1 Dynamic Momentum is a non-repainting momentum oscillator that turns a stochastic K/D pair into a complete two-way system: entries, signal exits, ATR take profit and stop loss, a position state machine and a live status dashboard. Every extra filter is switchable, so the classic signal-only behaviour is one click away.
█ CONCEPTS
The engine normalises price strength inside a long lookback window and compares a fast/slow EMA difference against its own smoothed average to define the momentum regime.
Key principles:
• Momentum core: K and D lines built from normalised price strength, crossed to time shifts in momentum.
• Regime context: translucent green and red bands behind the oscillator show whether momentum is expanding up or down.
• Governance: a state machine keeps signals mutually exclusive, so one bar flips the state at most once.
• Risk: ATR multiples anchored to the entry price produce stop loss and take profit levels that also fire exits and alerts.
█ SIGNALS
Labels on the oscillator
• E — long entry when K crosses up through D, green label below the lines
• S — short entry when K crosses down through D, red label above the lines
• XL / XS — long or short signal exit, orange cross
• TP / SL / TS — exit triggered by take profit, stop loss or trailing stop
• RL / RS — optional re-entry breakout after a signal exit, teal or maroon
Other visuals
• Yellow K line, magenta D line, coloured fill between them
• Plum threshold line at 50, plus optional zone lines at 40 and 60
• Background tint follows the open position
• Dashboard: position, last signal, regime, HTF gate, ATR, stop loss, take profit, cooldown
█ HOW TO USE
1 — Apply the indicator to any symbol and timeframe; the defaults are the original L1 values.
2 — Prefer E labels while the regime band is green and S labels while it is red, or switch on Require Momentum Regime Alignment and let the script decide.
3 — Manage risk with the plotted stop loss and take profit lines, or switch off Auto-Exit on TP/SL Hit for signal-only exits.
4 — Build alerts from the eight alert channels and set them to Once Per Bar Close.
Input Parameters
• Stochastic Lookback, K and D Smoothing: oscillator speed, 89 / 3 / 3
• Fast and Slow EMA Length, Momentum Smoothing: regime definition, 13 / 34 / 3
• Enable Long / Short Signals: disable either direction for one-way markets
• Require Threshold Zone: only accept crosses below 40 or above 60
• Cooldown Bars: minimum spacing between entries, 3 by default, 0 disables
• Stop Loss and Take Profit in ATR multiples: 2.0 and 3.0
• Chandelier Trailing Stop: ratcheting stop, off by default
• Momentum Regime Flip or Extreme Anchor Break exits: alternative exits, off
• Enable Re-entry, Enable HTF Gate: optional confirmations, off
█ FEATURES
• Two-way signals governed by a state machine, cooldown and exclusivity
• ATR stop loss, take profit and optional trailing stop, plotted and alertable
• Eight alert channels plus close-confirmed dynamic alerts that carry the price
• Zero-repaint higher-timeframe gate built on closed HTF bars
• Grouped inputs with min and max limits; every filter has an on/off switch
█ IMPLEMENTATION NOTES
Built on ta.sma, ta.ema, ta.atr, ta.crossover and ta.crossunder, with one request.security call that reads the previous closed higher-timeframe bar with barmerge.lookahead_on, so the gate never repaints. Division by zero is guarded when the lookback range is flat. Signals confirm at the close, so live alerting should use close confirmation.
█ LIMITATIONS
• Mean-reverting by design: in strong trends K and D can stay pinned and crosses arrive late
• Cooldown and filters lower the signal count; test any preset before using it
• The HTF gate does not support non-standard intervals such as Renko or Heikin Ashi
• This is an indicator, not a strategy: no equity curve or trade list is generated
█ NOTES
• V2 keeps the V1 algorithm and defaults; set Auto-Exit on TP/SL Hit to false and Cooldown Bars to 0 to reproduce V1 signal timing
• Source published under the Mozilla Public License 2.0
═════════════════════════════════════════════════════════════════════════
For questions or feedback, use comments section below.
Feel free to use and modify — attribution appreciated.

Don't miss out! The first and most important thing to do is to join my Discord chat now! Click here to start your adventure: discord.com/invite/ZTGpQJq My new github for more pine development soon: github.com/wxt-coder
คำจำกัดสิทธิ์ความรับผิดชอบ
ข้อมูลและบทความไม่ได้มีวัตถุประสงค์เพื่อก่อให้เกิดกิจกรรมทางการเงิน, การลงทุน, การซื้อขาย, ข้อเสนอแนะ หรือคำแนะนำประเภทอื่น ๆ ที่ให้หรือรับรองโดย TradingView อ่านเพิ่มเติมใน ข้อกำหนดการใช้งาน
Don't miss out! The first and most important thing to do is to join my Discord chat now! Click here to start your adventure: discord.com/invite/ZTGpQJq My new github for more pine development soon: github.com/wxt-coder
คำจำกัดสิทธิ์ความรับผิดชอบ
ข้อมูลและบทความไม่ได้มีวัตถุประสงค์เพื่อก่อให้เกิดกิจกรรมทางการเงิน, การลงทุน, การซื้อขาย, ข้อเสนอแนะ หรือคำแนะนำประเภทอื่น ๆ ที่ให้หรือรับรองโดย TradingView อ่านเพิ่มเติมใน ข้อกำหนดการใช้งาน