OPEN-SOURCE SCRIPT
Hidden Markov Reversal Finder [UAlgo]
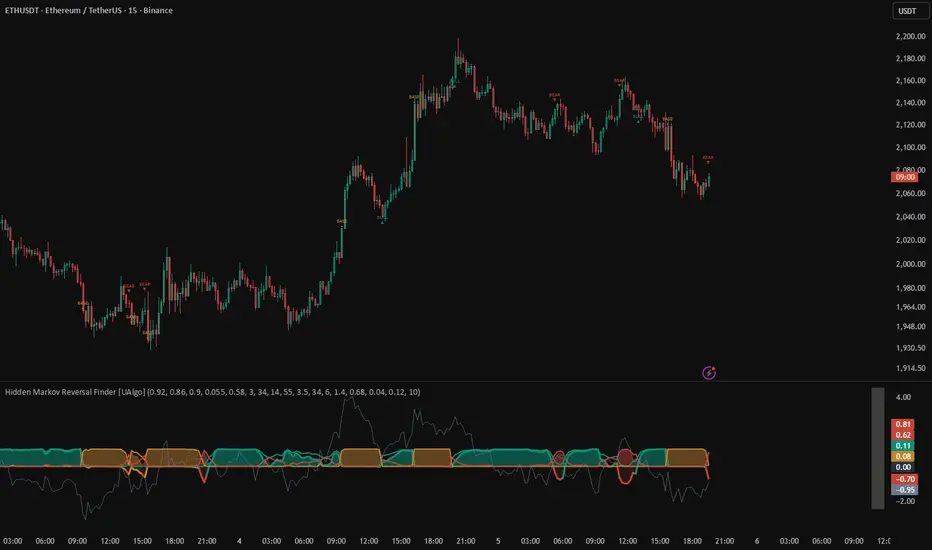
Hidden Markov Reversal Finder is a regime aware reversal detection indicator that uses a compact 3 state Hidden Markov style filter with online adaptation to classify market conditions and highlight potential top and bottom rotations. The script models price behavior as transitions between three regimes:
- Bull Expansion
- Balance
- Bear Stress
Instead of running a heavy Baum Welch retraining loop, this version is designed as a lightweight real time filter. It updates regime probabilities using a transition matrix plus a two dimensional Gaussian emission model built from two normalized observations:
Return observation as a smoothed log return z score
Volatility observation as a realized volatility z score
The indicator runs in its own pane (overlay=false) but can optionally paint chart bars and place reversal labels on price using force overlay. It also includes a clean dashboard panel showing the current state, confidence, observation values, score, posterior probabilities, stretch, and the current setup classification.
The reversal engine is built around a top rotation and bottom rotation concept. It looks for a probability peak in a regime, then a fade from that peak, combined with momentum flip conditions and a stretch filter measured in ATR units relative to a baseline EMA. Signals are gated by a confidence threshold and a cooldown period to reduce repetitive prints.
This makes the indicator useful as a regime driven reversal framework that integrates:
State probabilities and confidence
Regime score and momentum flip
ATR based stretch extremes
Peak fade rotation logic
Clean visual markers and dashboard transparency
🔹 Features
🔸 1) Three Regime Model
The script uses three explicit regimes with distinct roles:
Bull Expansion, intended to represent positive drift conditions
Balance, intended to represent neutral or mixed drift
Bear Stress, intended to represent negative drift and higher stress conditions
Each regime has its own mean and variance assumptions for return and volatility, which are then adapted online.
🔸 2) Two Dimensional Observation System (Return and Volatility)
The model does not rely on only returns. It uses both:
A normalized return feature
A normalized volatility feature
This helps distinguish clean bullish trends from choppy balance periods, and balance periods from bearish stress regimes.
🔸 3) Transition Matrix with Persistence Controls
Users can control how sticky each regime is through persistence settings:
Bull persistence
Balance persistence
Bear persistence
The transition matrix is constructed so that most probability remains in the same regime, while the remainder flows into other regimes using asymmetric weights that reflect realistic behavior.
🔸 4) Real Time Bayesian Filter Update
Each bar, the model performs:
Prediction step using the transition matrix
Update step using Gaussian emissions
Posterior normalization
Active state selection by arg max
This produces a smooth probability based regime tracker suitable for live use.
🔸 5) Adaptation
After filtering, the model adapts its internal means and variances using a learning rate scaled by posterior responsibility. This allows the state distributions to slowly adjust to changing market conditions without full retraining.
This keeps the indicator responsive while still stable.
🔸 6) Regime Score Output
The main score line is:
Bull posterior minus Bear posterior
This produces a continuous signal that ranges between negative and positive values and functions as a regime tilt meter. A confidence ribbon is also plotted as an area band derived from the dominant posterior.
🔸 7) Confidence Gating and Visual Strength
Confidence is defined as the largest posterior probability among the three regimes. The script uses confidence to:
Gate reversal signals
Determine bar tint transparency when bar coloring is enabled
Decide whether state shift tags should be printed
This reduces noise during low clarity periods.
🔸 8) Rotation Style Reversal Engine
The reversal finder is built on rotation logic:
A top rotation occurs after a Bull probability peak fades while Bear probability begins to rise
A bottom rotation occurs after a Bear probability peak fades while Bull probability begins to rise
This is a probabilistic rotation concept rather than a simple oscillator crossover.
🔸 9) Momentum Flip Confirmation
Signals require momentum confirmation through:
Regime score change direction
Return observation crossing a flip threshold
This is designed to reduce premature top and bottom calls when the regime probabilities shift but price momentum has not actually flipped.
🔸 10) ATR Based Stretch Filter
The script computes stretch as distance from an EMA baseline measured in ATR units. Signals require:
Top signals only when stretch is above a positive threshold
Bottom signals only when stretch is below a negative threshold
This ensures reversal signals occur when price is extended, not when it is near equilibrium.
🔸 11) Cooldown Control
A cooldown setting prevents consecutive buy or sell reversal signals from printing too frequently. This is especially useful when the market chops around an extreme and repeatedly triggers partial rotation conditions.
🔸 12) Dashboard Panel
A table dashboard displays key information on the last bar:
Active state name
Confidence
Return z score and volatility z score
Regime score
Posterior probabilities
Stretch in ATR units
Current setup text such as BUY REVERSAL, SELL REVERSAL, TOP WATCH, BOTTOM WATCH, WAIT
This makes the indicator transparent and easy to interpret.
🔸 13) State Tags and Reversal Labels on Chart
When enabled, the script prints:
State tags such as BULL, BASE, BEAR with arrows
Reversal markers with a vertical guide line and bold letter B or S
Tooltips include confidence, peak probability, stretch, and current posterior probabilities.
🔸 14) Optional Probability Curves and Bar Coloring
Users can toggle:
State probability plots
Signal markers and dots
Dashboard visibility
State tag visibility
Bar coloring by regime with confidence adjusted transparency
This makes the indicator adaptable for minimalist or fully informational workflows.
🔹 Calculations
1) Return Observation Construction
The script uses log returns:
Pine Script®
It smooths return with an EMA:
Pine Script®
Then normalizes by the return standard deviation:
Pine Script®
Interpretation:
Return observation is a clamped z score like feature, where positive values represent bullish return pressure and negative values represent bearish return pressure.
2) Volatility Observation Construction
Realized volatility is measured as the standard deviation of log returns:
Pine Script®
Then it is normalized relative to a baseline EMA and baseline standard deviation:
Pine Script®
Interpretation:
Volatility observation is a clamped z score like feature, where higher values indicate volatility expansion relative to baseline.
3) Warmup Logic
The model waits for enough history to compute stable normalized observations:
Pine Script®
Before ready, the script avoids producing live signals and uses the initial posterior distribution.
4) Transition Matrix Configuration
The transition matrix uses persistence values and asymmetric drift splits:
From Bull, most drift flows to Balance and a smaller portion to Bear
From Bear, most drift flows to Balance and a smaller portion to Bull
From Balance, drift splits evenly between Bull and Bear
Core setup:
Pine Script®
This design makes Balance act like a bridge regime and reduces unrealistic direct flip frequency.
5) Emission Model: 2D Gaussian Density
Each state computes an emission probability from return and volatility observations using a 2D Gaussian likelihood:
Pine Script®
Variances are floored at 0.12 to prevent collapse.
6) Prediction Step
The model predicts next probabilities using the transition matrix:
Pine Script®
Then normalizes the predicted vector so it sums to 1.
7) Filter Update Step
The posterior is updated by multiplying predicted probabilities by emission likelihoods:
Pine Script®
Then normalized. The active state is the arg max of the posterior.
8) Online Adaptation
The model updates state means and variances using posterior responsibility times learning rate:
Pine Script®
Means update by moving toward the current observation:
Pine Script®
Variances update toward squared error:
Pine Script®
All parameters are clamped to stability ranges so the model does not explode.
9) Regime Score and Confidence
Score is defined as:
Pine Script®
Confidence is the maximum posterior:
Pine Script®
These values drive visuals and signal gating.
10) Stretch Calculation in ATR Units
Stretch uses an EMA basis of price and measures distance in ATR units:
Pine Script®
Top stretch requires:
Pine Script®
Bottom stretch requires:
Pine Script®
This ensures reversals occur when price is statistically extended relative to recent volatility.
11) Probability Peak and Fade Logic
The script measures recent peaks for bull and bear probabilities:
Pine Script®
Fade is peak minus current:
Pine Script®
Top rotation condition requires:
Bull peak above threshold
Bull fade above minimum
Bear probability rising
Bottom rotation requires the mirrored conditions.
This captures the idea of regime dominance peaking, then fading as the opposite side begins to regain influence.
12) Momentum Flip Confirmation
Momentum down requires:
Regime score decreasing
Return observation strongly negative below a flip threshold
Momentum up requires:
Regime score increasing
Return observation strongly positive above the flip threshold
This prevents signals when probabilities fade but momentum remains neutral.
13) Signal Gating and Cooldown
Signals require confidence above the threshold and a cooldown to avoid repeated triggers:
Pine Script®
14) Buy and Sell Reversal Signals
Buy reversal:
Bottom rotation
Momentum up
Bottom stretch
Confidence filter
Cooldown filter
Sell reversal:
Top rotation
Momentum down
Top stretch
Confidence filter
Cooldown filter
A Balance signal is also triggered when the state changes to Balance with sufficient confidence.
15) Visual Outputs
The indicator plots:
Regime score line with area fill around zero
Confidence ribbon as an area band
Optional posterior curves for Bull, Balance, Bear
Normalized stretch line scaled by the stretch threshold
Optional dots on the chart for reversal events
Optional bar coloring on the main chart
It also prints:
Reversal labels B and S with stretch, confidence, and peak probability tooltips
State tags on regime shifts
A dashboard panel summarizing live state and setup context
- Bull Expansion
- Balance
- Bear Stress
Instead of running a heavy Baum Welch retraining loop, this version is designed as a lightweight real time filter. It updates regime probabilities using a transition matrix plus a two dimensional Gaussian emission model built from two normalized observations:
Return observation as a smoothed log return z score
Volatility observation as a realized volatility z score
The indicator runs in its own pane (overlay=false) but can optionally paint chart bars and place reversal labels on price using force overlay. It also includes a clean dashboard panel showing the current state, confidence, observation values, score, posterior probabilities, stretch, and the current setup classification.
The reversal engine is built around a top rotation and bottom rotation concept. It looks for a probability peak in a regime, then a fade from that peak, combined with momentum flip conditions and a stretch filter measured in ATR units relative to a baseline EMA. Signals are gated by a confidence threshold and a cooldown period to reduce repetitive prints.
This makes the indicator useful as a regime driven reversal framework that integrates:
State probabilities and confidence
Regime score and momentum flip
ATR based stretch extremes
Peak fade rotation logic
Clean visual markers and dashboard transparency
🔹 Features
🔸 1) Three Regime Model
The script uses three explicit regimes with distinct roles:
Bull Expansion, intended to represent positive drift conditions
Balance, intended to represent neutral or mixed drift
Bear Stress, intended to represent negative drift and higher stress conditions
Each regime has its own mean and variance assumptions for return and volatility, which are then adapted online.
🔸 2) Two Dimensional Observation System (Return and Volatility)
The model does not rely on only returns. It uses both:
A normalized return feature
A normalized volatility feature
This helps distinguish clean bullish trends from choppy balance periods, and balance periods from bearish stress regimes.
🔸 3) Transition Matrix with Persistence Controls
Users can control how sticky each regime is through persistence settings:
Bull persistence
Balance persistence
Bear persistence
The transition matrix is constructed so that most probability remains in the same regime, while the remainder flows into other regimes using asymmetric weights that reflect realistic behavior.
🔸 4) Real Time Bayesian Filter Update
Each bar, the model performs:
Prediction step using the transition matrix
Update step using Gaussian emissions
Posterior normalization
Active state selection by arg max
This produces a smooth probability based regime tracker suitable for live use.
🔸 5) Adaptation
After filtering, the model adapts its internal means and variances using a learning rate scaled by posterior responsibility. This allows the state distributions to slowly adjust to changing market conditions without full retraining.
This keeps the indicator responsive while still stable.
🔸 6) Regime Score Output
The main score line is:
Bull posterior minus Bear posterior
This produces a continuous signal that ranges between negative and positive values and functions as a regime tilt meter. A confidence ribbon is also plotted as an area band derived from the dominant posterior.
🔸 7) Confidence Gating and Visual Strength
Confidence is defined as the largest posterior probability among the three regimes. The script uses confidence to:
Gate reversal signals
Determine bar tint transparency when bar coloring is enabled
Decide whether state shift tags should be printed
This reduces noise during low clarity periods.
🔸 8) Rotation Style Reversal Engine
The reversal finder is built on rotation logic:
A top rotation occurs after a Bull probability peak fades while Bear probability begins to rise
A bottom rotation occurs after a Bear probability peak fades while Bull probability begins to rise
This is a probabilistic rotation concept rather than a simple oscillator crossover.
🔸 9) Momentum Flip Confirmation
Signals require momentum confirmation through:
Regime score change direction
Return observation crossing a flip threshold
This is designed to reduce premature top and bottom calls when the regime probabilities shift but price momentum has not actually flipped.
🔸 10) ATR Based Stretch Filter
The script computes stretch as distance from an EMA baseline measured in ATR units. Signals require:
Top signals only when stretch is above a positive threshold
Bottom signals only when stretch is below a negative threshold
This ensures reversal signals occur when price is extended, not when it is near equilibrium.
🔸 11) Cooldown Control
A cooldown setting prevents consecutive buy or sell reversal signals from printing too frequently. This is especially useful when the market chops around an extreme and repeatedly triggers partial rotation conditions.
🔸 12) Dashboard Panel
A table dashboard displays key information on the last bar:
Active state name
Confidence
Return z score and volatility z score
Regime score
Posterior probabilities
Stretch in ATR units
Current setup text such as BUY REVERSAL, SELL REVERSAL, TOP WATCH, BOTTOM WATCH, WAIT
This makes the indicator transparent and easy to interpret.
🔸 13) State Tags and Reversal Labels on Chart
When enabled, the script prints:
State tags such as BULL, BASE, BEAR with arrows
Reversal markers with a vertical guide line and bold letter B or S
Tooltips include confidence, peak probability, stretch, and current posterior probabilities.
🔸 14) Optional Probability Curves and Bar Coloring
Users can toggle:
State probability plots
Signal markers and dots
Dashboard visibility
State tag visibility
Bar coloring by regime with confidence adjusted transparency
This makes the indicator adaptable for minimalist or fully informational workflows.
🔹 Calculations
1) Return Observation Construction
The script uses log returns:
It smooths return with an EMA:
Then normalizes by the return standard deviation:
Interpretation:
Return observation is a clamped z score like feature, where positive values represent bullish return pressure and negative values represent bearish return pressure.
2) Volatility Observation Construction
Realized volatility is measured as the standard deviation of log returns:
Then it is normalized relative to a baseline EMA and baseline standard deviation:
Interpretation:
Volatility observation is a clamped z score like feature, where higher values indicate volatility expansion relative to baseline.
3) Warmup Logic
The model waits for enough history to compute stable normalized observations:
Before ready, the script avoids producing live signals and uses the initial posterior distribution.
4) Transition Matrix Configuration
The transition matrix uses persistence values and asymmetric drift splits:
From Bull, most drift flows to Balance and a smaller portion to Bear
From Bear, most drift flows to Balance and a smaller portion to Bull
From Balance, drift splits evenly between Bull and Bear
Core setup:
This design makes Balance act like a bridge regime and reduces unrealistic direct flip frequency.
5) Emission Model: 2D Gaussian Density
Each state computes an emission probability from return and volatility observations using a 2D Gaussian likelihood:
Variances are floored at 0.12 to prevent collapse.
6) Prediction Step
The model predicts next probabilities using the transition matrix:
Then normalizes the predicted vector so it sums to 1.
7) Filter Update Step
The posterior is updated by multiplying predicted probabilities by emission likelihoods:
Then normalized. The active state is the arg max of the posterior.
8) Online Adaptation
The model updates state means and variances using posterior responsibility times learning rate:
Means update by moving toward the current observation:
Variances update toward squared error:
All parameters are clamped to stability ranges so the model does not explode.
9) Regime Score and Confidence
Score is defined as:
Confidence is the maximum posterior:
These values drive visuals and signal gating.
10) Stretch Calculation in ATR Units
Stretch uses an EMA basis of price and measures distance in ATR units:
Top stretch requires:
Bottom stretch requires:
This ensures reversals occur when price is statistically extended relative to recent volatility.
11) Probability Peak and Fade Logic
The script measures recent peaks for bull and bear probabilities:
Fade is peak minus current:
Top rotation condition requires:
Bull peak above threshold
Bull fade above minimum
Bear probability rising
Bottom rotation requires the mirrored conditions.
This captures the idea of regime dominance peaking, then fading as the opposite side begins to regain influence.
12) Momentum Flip Confirmation
Momentum down requires:
Regime score decreasing
Return observation strongly negative below a flip threshold
Momentum up requires:
Regime score increasing
Return observation strongly positive above the flip threshold
This prevents signals when probabilities fade but momentum remains neutral.
13) Signal Gating and Cooldown
Signals require confidence above the threshold and a cooldown to avoid repeated triggers:
14) Buy and Sell Reversal Signals
Buy reversal:
Bottom rotation
Momentum up
Bottom stretch
Confidence filter
Cooldown filter
Sell reversal:
Top rotation
Momentum down
Top stretch
Confidence filter
Cooldown filter
A Balance signal is also triggered when the state changes to Balance with sufficient confidence.
15) Visual Outputs
The indicator plots:
Regime score line with area fill around zero
Confidence ribbon as an area band
Optional posterior curves for Bull, Balance, Bear
Normalized stretch line scaled by the stretch threshold
Optional dots on the chart for reversal events
Optional bar coloring on the main chart
It also prints:
Reversal labels B and S with stretch, confidence, and peak probability tooltips
State tags on regime shifts
A dashboard panel summarizing live state and setup context
สคริปต์โอเพนซอร์ซ
ด้วยเจตนารมณ์หลักของ TradingView ผู้สร้างสคริปต์นี้ได้ทำให้เป็นโอเพนซอร์ส เพื่อให้เทรดเดอร์สามารถตรวจสอบและยืนยันฟังก์ชันการทำงานของมันได้ ขอชื่นชมผู้เขียน! แม้ว่าคุณจะใช้งานได้ฟรี แต่โปรดจำไว้ว่าการเผยแพร่โค้ดซ้ำจะต้องเป็นไปตาม กฎระเบียบการใช้งาน ของเรา

Get exclusive indicators
All content provided by UAlgo is for informational & educational purposes only. Past performance does not guarantee future results.
All content provided by UAlgo is for informational & educational purposes only. Past performance does not guarantee future results.
คำจำกัดสิทธิ์ความรับผิดชอบ
ข้อมูลและบทความไม่ได้มีวัตถุประสงค์เพื่อก่อให้เกิดกิจกรรมทางการเงิน, การลงทุน, การซื้อขาย, ข้อเสนอแนะ หรือคำแนะนำประเภทอื่น ๆ ที่ให้หรือรับรองโดย TradingView อ่านเพิ่มเติมใน ข้อกำหนดการใช้งาน
สคริปต์โอเพนซอร์ซ
ด้วยเจตนารมณ์หลักของ TradingView ผู้สร้างสคริปต์นี้ได้ทำให้เป็นโอเพนซอร์ส เพื่อให้เทรดเดอร์สามารถตรวจสอบและยืนยันฟังก์ชันการทำงานของมันได้ ขอชื่นชมผู้เขียน! แม้ว่าคุณจะใช้งานได้ฟรี แต่โปรดจำไว้ว่าการเผยแพร่โค้ดซ้ำจะต้องเป็นไปตาม กฎระเบียบการใช้งาน ของเรา
Get exclusive indicators
All content provided by UAlgo is for informational & educational purposes only. Past performance does not guarantee future results.
All content provided by UAlgo is for informational & educational purposes only. Past performance does not guarantee future results.
คำจำกัดสิทธิ์ความรับผิดชอบ
ข้อมูลและบทความไม่ได้มีวัตถุประสงค์เพื่อก่อให้เกิดกิจกรรมทางการเงิน, การลงทุน, การซื้อขาย, ข้อเสนอแนะ หรือคำแนะนำประเภทอื่น ๆ ที่ให้หรือรับรองโดย TradingView อ่านเพิ่มเติมใน ข้อกำหนดการใช้งาน