OPEN-SOURCE SCRIPT
COT: Noncommercial Net (Futures)
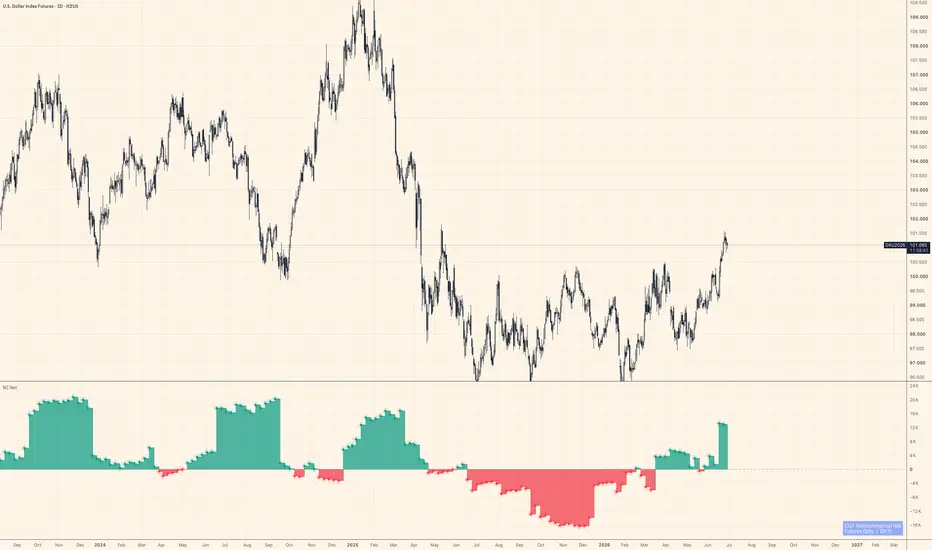
The CFTC publishes Commitment of Traders data every Friday. Inside that report, the "Noncommercial" category — large speculators, managed money, trend-followers — is the one most traders actually want to watch. This script strips everything else away and shows their net stance: Long minus Short, futures contracts only.
Positive values mean large speculators are net long. Negative means net short. A move across zero often marks a meaningful shift in positioning, not just noise.
How it works
The indicator auto-detects the correct CFTC code from the chart's symbol using TradingView's official LibraryCOT, so you don't need to configure anything. Open it on BTC futures, gold, crude oil, the yen — it resolves the code and pulls the right data automatically.
A teal/red histogram shows whether net positioning is positive or negative. A step-line sits on top for precise bar-by-bar reading. Zero is marked with a dashed reference line.
What it doesn't do
It doesn't tell you when to buy or sell. COT data is released weekly and lags several days behind the reporting cutoff — it's positioning context, not a signal. Use it alongside price action and other tools to understand who is leaning which way, not as a standalone trigger.
Notes
Futures only (not futures + options combined)
Noncommercial Long − Noncommercial Short = Net
Data source: CFTC Legacy report via TradingView's LibraryCOT v6
Works on any symbol that has a CFTC code in TradingView's database
Not financial advice. Position sizing and risk management are your responsibility.
Positive values mean large speculators are net long. Negative means net short. A move across zero often marks a meaningful shift in positioning, not just noise.
How it works
The indicator auto-detects the correct CFTC code from the chart's symbol using TradingView's official LibraryCOT, so you don't need to configure anything. Open it on BTC futures, gold, crude oil, the yen — it resolves the code and pulls the right data automatically.
A teal/red histogram shows whether net positioning is positive or negative. A step-line sits on top for precise bar-by-bar reading. Zero is marked with a dashed reference line.
What it doesn't do
It doesn't tell you when to buy or sell. COT data is released weekly and lags several days behind the reporting cutoff — it's positioning context, not a signal. Use it alongside price action and other tools to understand who is leaning which way, not as a standalone trigger.
Notes
Futures only (not futures + options combined)
Noncommercial Long − Noncommercial Short = Net
Data source: CFTC Legacy report via TradingView's LibraryCOT v6
Works on any symbol that has a CFTC code in TradingView's database
Not financial advice. Position sizing and risk management are your responsibility.
สคริปต์แบบโอเพนซอร์ส
ด้วยเจตนารมณ์หลักของ TradingView ผู้สร้างสคริปต์นี้ได้ทำให้เป็นโอเพนซอร์ส เพื่อให้เทรดเดอร์สามารถตรวจสอบและยืนยันฟังก์ชันการทำงานของมันได้ ขอชื่นชมผู้เขียน! แม้ว่าคุณจะใช้งานได้ฟรี แต่โปรดจำไว้ว่าการเผยแพร่โค้ดซ้ำจะต้องเป็นไปตาม กฎระเบียบการใช้งาน ของเรา

If you've ever wondered why gold and Bitcoin sometimes move with dollar liquidity and sometimes don't, that's basically all I post about here. The free script behind it (CB Hunter) is on my profile.
คำจำกัดสิทธิ์ความรับผิดชอบ
ข้อมูลและบทความไม่ได้มีวัตถุประสงค์เพื่อก่อให้เกิดกิจกรรมทางการเงิน, การลงทุน, การซื้อขาย, ข้อเสนอแนะ หรือคำแนะนำประเภทอื่น ๆ ที่ให้หรือรับรองโดย TradingView อ่านเพิ่มเติมใน ข้อกำหนดการใช้งาน
สคริปต์แบบโอเพนซอร์ส
ด้วยเจตนารมณ์หลักของ TradingView ผู้สร้างสคริปต์นี้ได้ทำให้เป็นโอเพนซอร์ส เพื่อให้เทรดเดอร์สามารถตรวจสอบและยืนยันฟังก์ชันการทำงานของมันได้ ขอชื่นชมผู้เขียน! แม้ว่าคุณจะใช้งานได้ฟรี แต่โปรดจำไว้ว่าการเผยแพร่โค้ดซ้ำจะต้องเป็นไปตาม กฎระเบียบการใช้งาน ของเรา
If you've ever wondered why gold and Bitcoin sometimes move with dollar liquidity and sometimes don't, that's basically all I post about here. The free script behind it (CB Hunter) is on my profile.
คำจำกัดสิทธิ์ความรับผิดชอบ
ข้อมูลและบทความไม่ได้มีวัตถุประสงค์เพื่อก่อให้เกิดกิจกรรมทางการเงิน, การลงทุน, การซื้อขาย, ข้อเสนอแนะ หรือคำแนะนำประเภทอื่น ๆ ที่ให้หรือรับรองโดย TradingView อ่านเพิ่มเติมใน ข้อกำหนดการใช้งาน