STDV | 15m + 5m + 1m Manipulation Legs
# STDV Manipulation Leg Engine
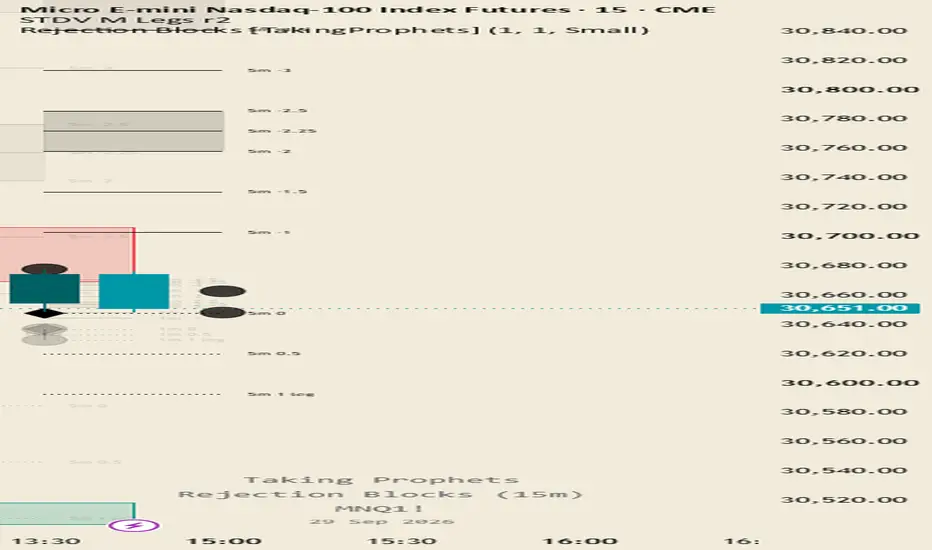
**STDV Manipulation Leg Engine** is a focused multi-timeframe tool designed to automatically identify meaningful manipulation legs and project Standard Deviation levels from them.
The concept is simple:
**Manipulation → Structure Shift → STDV Expansion**
Instead of projecting from arbitrary swings, the indicator attempts to isolate the price leg most closely connected to a meaningful reversal or structural transition.
## What It Does
The script independently analyzes:
- **15-minute structure**
- **5-minute structure**
- **1-minute structure**
Each timeframe runs its own STDV engine, allowing higher- and lower-timeframe structures to remain active at the same time.
This makes it possible to visualize nested manipulation sequences across multiple intraday timeframes without manually redrawing every projection.
## Automatic Leg Detection
The indicator looks for structurally relevant price movement such as:
- meaningful swing points;
- liquidity excursions beyond prior highs or lows;
- directional manipulation legs;
- subsequent structural confirmation;
- the most relevant anchor pair for the active sequence.
Once a leg is confirmed, its anchors are used to generate the corresponding STDV projection.
## STDV Levels
The script can display commonly used projected levels including:
- -1.0
- -1.5
- -2.0
- -2.25
- -2.5
- -3.5
- -4.0
- -4.75
These levels are intended as **objective reference zones for price expansion**, not automatic trade signals.
## Multi-Timeframe Confluence
One of the main advantages of the indicator is the ability to compare several independent STDV structures at once.
For example, a 15-minute projection may remain active while a new 5-minute or 1-minute manipulation leg develops inside it.
When projections from different timeframes begin clustering around a similar price area, traders can use that information as an additional point of context.
## Developing and Confirmed Structure
Developing legs may update as price continues to form.
Once the required structural confirmation occurs, the leg becomes confirmed and its anchors are intended to remain fixed.
This helps distinguish live developing information from confirmed historical structure.
## Designed to Stay Focused
This is intentionally not an all-in-one indicator.
It does not rely on:
- moving averages;
- VWAP;
- Bollinger Bands;
- RSI or MACD;
- order blocks;
- FVG signals;
- volume profile;
- automatic buy/sell signals.
The goal is to keep the chart clean and focus specifically on **manipulation-leg structure and STDV projection mapping**.
## Suggested Applications
The indicator can be used for:
- identifying potential expansion objectives;
- studying manipulation-to-expansion behavior;
- comparing 15m, 5m, and 1m structure;
- locating multi-timeframe projection overlap;
- adding objective STDV levels to discretionary price-action analysis.
It is designed primarily for intraday futures and index markets, although the underlying methodology may be applied to other sufficiently liquid markets.
## Important
STDV levels are not guaranteed support, resistance, entries, exits, or targets.
Market structure, volatility, session context, and risk management should always be considered separately.
This indicator is provided for educational and analytical purposes only and does not constitute financial advice.
**STDV Manipulation Leg Engine** is a focused multi-timeframe tool designed to automatically identify meaningful manipulation legs and project Standard Deviation levels from them.
The concept is simple:
**Manipulation → Structure Shift → STDV Expansion**
Instead of projecting from arbitrary swings, the indicator attempts to isolate the price leg most closely connected to a meaningful reversal or structural transition.
## What It Does
The script independently analyzes:
- **15-minute structure**
- **5-minute structure**
- **1-minute structure**
Each timeframe runs its own STDV engine, allowing higher- and lower-timeframe structures to remain active at the same time.
This makes it possible to visualize nested manipulation sequences across multiple intraday timeframes without manually redrawing every projection.
## Automatic Leg Detection
The indicator looks for structurally relevant price movement such as:
- meaningful swing points;
- liquidity excursions beyond prior highs or lows;
- directional manipulation legs;
- subsequent structural confirmation;
- the most relevant anchor pair for the active sequence.
Once a leg is confirmed, its anchors are used to generate the corresponding STDV projection.
## STDV Levels
The script can display commonly used projected levels including:
- -1.0
- -1.5
- -2.0
- -2.25
- -2.5
- -3.5
- -4.0
- -4.75
These levels are intended as **objective reference zones for price expansion**, not automatic trade signals.
## Multi-Timeframe Confluence
One of the main advantages of the indicator is the ability to compare several independent STDV structures at once.
For example, a 15-minute projection may remain active while a new 5-minute or 1-minute manipulation leg develops inside it.
When projections from different timeframes begin clustering around a similar price area, traders can use that information as an additional point of context.
## Developing and Confirmed Structure
Developing legs may update as price continues to form.
Once the required structural confirmation occurs, the leg becomes confirmed and its anchors are intended to remain fixed.
This helps distinguish live developing information from confirmed historical structure.
## Designed to Stay Focused
This is intentionally not an all-in-one indicator.
It does not rely on:
- moving averages;
- VWAP;
- Bollinger Bands;
- RSI or MACD;
- order blocks;
- FVG signals;
- volume profile;
- automatic buy/sell signals.
The goal is to keep the chart clean and focus specifically on **manipulation-leg structure and STDV projection mapping**.
## Suggested Applications
The indicator can be used for:
- identifying potential expansion objectives;
- studying manipulation-to-expansion behavior;
- comparing 15m, 5m, and 1m structure;
- locating multi-timeframe projection overlap;
- adding objective STDV levels to discretionary price-action analysis.
It is designed primarily for intraday futures and index markets, although the underlying methodology may be applied to other sufficiently liquid markets.
## Important
STDV levels are not guaranteed support, resistance, entries, exits, or targets.
Market structure, volatility, session context, and risk management should always be considered separately.
This indicator is provided for educational and analytical purposes only and does not constitute financial advice.

คำจำกัดสิทธิ์ความรับผิดชอบ
ข้อมูลและบทความไม่ได้มีวัตถุประสงค์เพื่อก่อให้เกิดกิจกรรมทางการเงิน, การลงทุน, การซื้อขาย, ข้อเสนอแนะ หรือคำแนะนำประเภทอื่น ๆ ที่ให้หรือรับรองโดย TradingView อ่านเพิ่มเติมใน ข้อกำหนดการใช้งาน
คำจำกัดสิทธิ์ความรับผิดชอบ
ข้อมูลและบทความไม่ได้มีวัตถุประสงค์เพื่อก่อให้เกิดกิจกรรมทางการเงิน, การลงทุน, การซื้อขาย, ข้อเสนอแนะ หรือคำแนะนำประเภทอื่น ๆ ที่ให้หรือรับรองโดย TradingView อ่านเพิ่มเติมใน ข้อกำหนดการใช้งาน