XAUUSD Family Supertrend (RSI/MFI Momentum Bands)
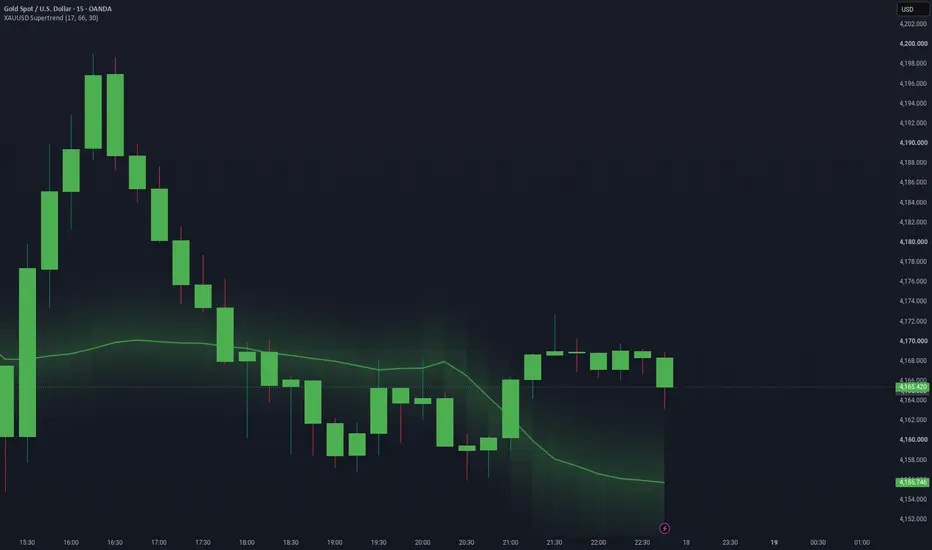
This overlay plots a trend line built from a range-weighted moving average (RWMA) of the close over 20 bars, where each bar is weighted by its high-low range. A momentum state decides where the line sits: the script averages a Wilder-smoothed RSI and the Money Flow Index (both using the Supertrend length input) into one RSI/MFI value. A bullish state starts when this value crosses above the Positive level while the 5 EMA is rising, and a bearish state starts when it is below the Negative level while the 5 EMA is falling. In a bullish state the line is drawn below the RWMA by a volatility band (based on ATR(30), capped at 0.3% of price), coloured green with a fading fill underneath; in a bearish state it is drawn above the RWMA in red with the fill on top. Candles are recoloured green or red to match the state, a small up arrow marks a new bullish state, and BUY/SELL alert conditions fire when the state flips.
Main inputs: Supertrend length (default 17) sets the RSI and MFI lookback, where higher values give a smoother momentum reading and fewer state changes. Positive above (default 66) is the level the RSI/MFI average must cross up through to turn bullish; raising it makes bullish flips rarer. Negative below (default 30) is the level it must be under to turn bearish; lowering it makes bearish flips rarer. Show Range MA toggles the line and band fill, and the two colour inputs set the bullish and bearish colours.
How to use: a green line below price with green candles indicates a bullish momentum state, and a red line above price with red candles indicates a bearish state. A colour flip shows that momentum has changed state and can be used as a trend filter, for example only looking for long setups in your own analysis while the state is bullish and short setups while it is bearish. The line can also serve as a reference for trailing levels. Always combine it with your own analysis and proper risk management.
Limitations: the line is based on moving averages and momentum thresholds, so it lags price and flips after a move has already started. In sideways or choppy markets the RSI/MFI average can cross the levels repeatedly and produce whipsaws. States and arrows can change while a bar is still forming and are only confirmed on bar close. MFI uses volume, so results depend on the volume data supplied for the symbol.
For educational purposes. Not financial advice.
Main inputs: Supertrend length (default 17) sets the RSI and MFI lookback, where higher values give a smoother momentum reading and fewer state changes. Positive above (default 66) is the level the RSI/MFI average must cross up through to turn bullish; raising it makes bullish flips rarer. Negative below (default 30) is the level it must be under to turn bearish; lowering it makes bearish flips rarer. Show Range MA toggles the line and band fill, and the two colour inputs set the bullish and bearish colours.
How to use: a green line below price with green candles indicates a bullish momentum state, and a red line above price with red candles indicates a bearish state. A colour flip shows that momentum has changed state and can be used as a trend filter, for example only looking for long setups in your own analysis while the state is bullish and short setups while it is bearish. The line can also serve as a reference for trailing levels. Always combine it with your own analysis and proper risk management.
Limitations: the line is based on moving averages and momentum thresholds, so it lags price and flips after a move has already started. In sideways or choppy markets the RSI/MFI average can cross the levels repeatedly and produce whipsaws. States and arrows can change while a bar is still forming and are only confirmed on bar close. MFI uses volume, so results depend on the volume data supplied for the symbol.
For educational purposes. Not financial advice.

คำจำกัดสิทธิ์ความรับผิดชอบ
ข้อมูลและบทความไม่ได้มีวัตถุประสงค์เพื่อก่อให้เกิดกิจกรรมทางการเงิน, การลงทุน, การซื้อขาย, ข้อเสนอแนะ หรือคำแนะนำประเภทอื่น ๆ ที่ให้หรือรับรองโดย TradingView อ่านเพิ่มเติมใน ข้อกำหนดการใช้งาน
คำจำกัดสิทธิ์ความรับผิดชอบ
ข้อมูลและบทความไม่ได้มีวัตถุประสงค์เพื่อก่อให้เกิดกิจกรรมทางการเงิน, การลงทุน, การซื้อขาย, ข้อเสนอแนะ หรือคำแนะนำประเภทอื่น ๆ ที่ให้หรือรับรองโดย TradingView อ่านเพิ่มเติมใน ข้อกำหนดการใช้งาน