OPEN-SOURCE SCRIPT
MACD RSI Stochastic Buy/Sell Timing Table
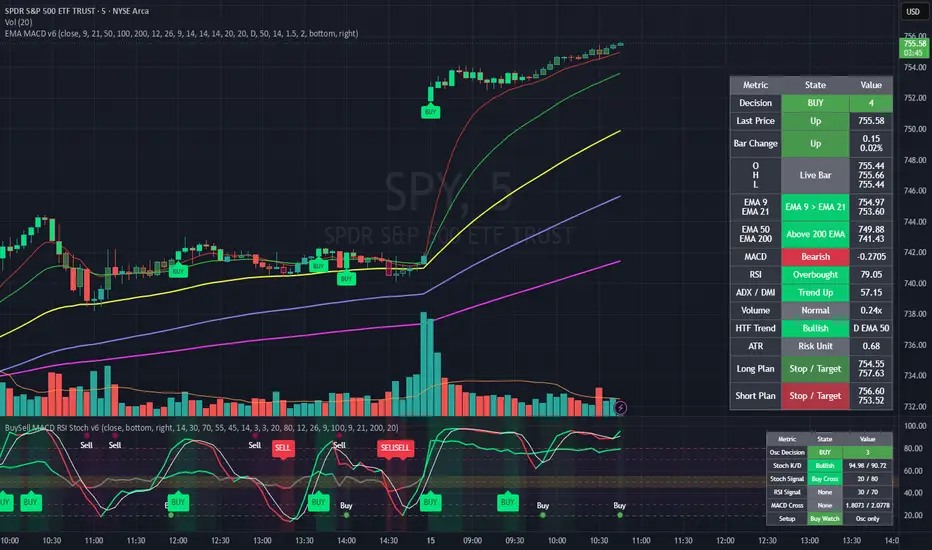
Buy/Sell MACD RSI Stochastics v6
This Pine Script v6 oscillator-pane indicator focuses on timing signals using RSI, Stochastic, MACD, optional EMA trend confirmation, and optional volume confirmation.
The script combines RSI levels and threshold crosses, Stochastic %K / %D relationships and crosses, MACD line / signal / histogram logic, buy and sell setup markers, strong buy and strong sell markers, a compact oscillator decision table, alerts, and Data Window values.
It calculates a numeric oscillator score on every bar. Bullish confirmations add points, bearish confirmations subtract points, and the final score is converted into Strong Buy, Buy / Watch Long, Neutral / Wait, Sell / Watch Short, or Strong Sell.
Strong BUY markers appear when the score first reaches Strong Buy territory. Strong SELL markers appear when the score first reaches Strong Sell territory. Smaller Buy and Sell setup markers appear when the score first reaches watch-long or watch-short territory.
This tool is designed for timing context and trade planning. It is not financial advice and does not guarantee trade results.
Scoring Logic
Condition | Score
--- | ---
RSI is at or above the bull bias level | +2
RSI is at or below the bear bias level | -2
RSI crosses above the buy level | +1
RSI crosses below the sell level | -1
Stochastic K is above D and K is above 50 | +2
Stochastic K is below D and K is below 50 | -2
Stochastic K crosses above D before the sell level | +1
Stochastic K crosses below D after the buy level | -1
Stochastic crosses above the buy level | +1
Stochastic crosses below the sell level | -1
MACD is above signal and histogram is above 0 | +2
MACD is below signal and histogram is below 0 | -2
MACD bullish crossover | +1
MACD bearish crossover | -1
EMA trend filter is bullish when enabled | +1
EMA trend filter is bearish when enabled | -1
Volume confirmation is bullish when enabled | +1
Volume confirmation is bearish when enabled | -1
Decision Output
Score Range | Decision | Pane Background | Decision Table Background
--- | --- | --- | ---
>= 6 | Strong Buy | Bright green | Bright lime
3 to 5 | Buy / Watch Long | Light green | Green
-2 to 2 | Neutral / Wait | No background | Gray
-3 to -5 | Sell / Watch Short | Light maroon/red | Maroon
<= -6 | Strong Sell | Bright red | Bright red
The pane background and decision table background use the same oscillator score ranges. The pane background is more transparent so the oscillator lines remain readable.
RSI Logic
RSI Level | Meaning
--- | ---
30 | Buy threshold
45 | Bear bias threshold
55 | Bull bias threshold
70 | Sell threshold
RSI contributes bullish score when it is above the bull bias level and bearish score when it is below the bear bias level.
An RSI cross above the buy level adds a smaller bullish timing point. An RSI cross below the sell level adds a smaller bearish timing point.
Stochastic Logic
Stochastic is bullish when %K is above %D and %K is above 50.
Stochastic is bearish when %K is below %D and %K is below 50.
Stochastic Event | Meaning
--- | ---
%K crosses above %D before the sell level | Bullish timing confirmation
%K crosses below %D after the buy level | Bearish timing confirmation
Stochastic crosses above the buy level | Bullish threshold confirmation
Stochastic crosses below the sell level | Bearish threshold confirmation
MACD Logic
MACD is bullish when the MACD line is above the signal line and the histogram is positive.
MACD is bearish when the MACD line is below the signal line and the histogram is negative.
A MACD line crossover above the signal line adds a bullish timing point. A cross below the signal line adds a bearish timing point.
MACD can be normalized for display so it fits in the same oscillator pane as RSI and Stochastic. The raw MACD values remain available in the Data Window.
EMA Trend Filter Logic
When enabled, the EMA trend filter checks the fast EMA, slow EMA, and long trend EMA.
Filter State | Condition
--- | ---
Bullish | Fast EMA above slow EMA and price above long trend EMA
Bearish | Fast EMA below slow EMA and price below long trend EMA
Disabled | Does not affect the score
Volume Logic
When enabled, volume confirmation compares current volume against average volume.
Volume State | Condition
--- | ---
Bullish confirmation | Above-average volume with a bullish candle
Bearish confirmation | Above-average volume with a bearish candle
No confirmation | Normal or low-volume candle
Disabled | Does not affect the score
Visual Output
The oscillator pane can show RSI, Stochastic %K, Stochastic %D, optional normalized MACD line and signal line, optional normalized MACD histogram, green or red background based on the decision score, Buy / Sell setup markers, and Strong BUY / SELL markers.
Green background means the oscillator score is bullish. Red background means the oscillator score is bearish. Stronger color appears when the score reaches strong buy or strong sell territory.
Decision Table Rows
Row | What It Shows | How To Read It
--- | --- | ---
Osc Decision | Final oscillator decision and oscillator score | Main timing summary. Strong Buy / Buy means momentum confirmations are bullish. Strong Sell / Sell means momentum confirmations are bearish. Neutral means timing is mixed.
Stoch K/D | Current Stochastic %K and %D relationship, plus both values | Bullish means %K is above %D and %K is above 50. Bearish means %K is below %D and %K is below 50. Mixed means the condition is not directional enough.
Stoch Signal | Whether Stochastic created a buy cross, sell cross, or no fresh cross | Buy Cross appears when %K crosses above %D or above the buy level. Sell Cross appears when %K crosses below %D or below the sell level. None means no fresh Stochastic cross is active.
RSI Signal | Whether RSI crossed the configured buy or sell threshold | Buy Cross appears when RSI crosses above the buy level. Sell Cross appears when RSI crosses below the sell level. None means no fresh RSI threshold cross is active.
MACD Cross | Whether MACD crossed its signal line, plus raw MACD and signal values | Bull Cross means MACD crossed above signal. Bear Cross means MACD crossed below signal. None means no fresh MACD crossover is active.
Setup | Trade-watch state produced by the oscillator score | Strong Buy and Strong Sell are the strongest timing states. Buy Watch and Sell Watch are earlier setup states. Wait means there is not enough directional agreement.
Use the table as a timing tool. It is strongest when the oscillator decision agrees with broader chart-level trend context.
Data Window Values
When enabled, the script exposes Decision Score, Decision Code, MACD Raw, MACD Signal Raw, and MACD Histogram Raw.
Code | Meaning
--- | ---
2 | Strong Buy
1 | Buy
0 | Neutral
-1 | Sell
-2 | Strong Sell
Alert Logic
The script includes alerts for Strong Buy Decision, Strong Sell Decision, Buy Setup, Sell Setup, RSI Buy Cross, RSI Sell Cross, Stochastic Buy Cross, Stochastic Sell Cross, MACD Bullish Cross, and MACD Bearish Cross.
Strong decision alerts come from the oscillator score entering strong buy or strong sell territory. Setup alerts come from the score entering watch-long or watch-short territory. Indicator cross alerts are based on their individual RSI, Stochastic, or MACD crossover conditions.
Reading The Output
This script is mainly a timing tool. Bullish output is strongest when RSI, Stochastic, MACD, trend filter, and volume all align. Bearish output is strongest when those same components align to the downside.
When used with the EMA MACD Decision Table script, the chart-level table gives broader trend context and this oscillator gives timing confirmation.
This Pine Script v6 oscillator-pane indicator focuses on timing signals using RSI, Stochastic, MACD, optional EMA trend confirmation, and optional volume confirmation.
The script combines RSI levels and threshold crosses, Stochastic %K / %D relationships and crosses, MACD line / signal / histogram logic, buy and sell setup markers, strong buy and strong sell markers, a compact oscillator decision table, alerts, and Data Window values.
It calculates a numeric oscillator score on every bar. Bullish confirmations add points, bearish confirmations subtract points, and the final score is converted into Strong Buy, Buy / Watch Long, Neutral / Wait, Sell / Watch Short, or Strong Sell.
Strong BUY markers appear when the score first reaches Strong Buy territory. Strong SELL markers appear when the score first reaches Strong Sell territory. Smaller Buy and Sell setup markers appear when the score first reaches watch-long or watch-short territory.
This tool is designed for timing context and trade planning. It is not financial advice and does not guarantee trade results.
Scoring Logic
Condition | Score
--- | ---
RSI is at or above the bull bias level | +2
RSI is at or below the bear bias level | -2
RSI crosses above the buy level | +1
RSI crosses below the sell level | -1
Stochastic K is above D and K is above 50 | +2
Stochastic K is below D and K is below 50 | -2
Stochastic K crosses above D before the sell level | +1
Stochastic K crosses below D after the buy level | -1
Stochastic crosses above the buy level | +1
Stochastic crosses below the sell level | -1
MACD is above signal and histogram is above 0 | +2
MACD is below signal and histogram is below 0 | -2
MACD bullish crossover | +1
MACD bearish crossover | -1
EMA trend filter is bullish when enabled | +1
EMA trend filter is bearish when enabled | -1
Volume confirmation is bullish when enabled | +1
Volume confirmation is bearish when enabled | -1
Decision Output
Score Range | Decision | Pane Background | Decision Table Background
--- | --- | --- | ---
>= 6 | Strong Buy | Bright green | Bright lime
3 to 5 | Buy / Watch Long | Light green | Green
-2 to 2 | Neutral / Wait | No background | Gray
-3 to -5 | Sell / Watch Short | Light maroon/red | Maroon
<= -6 | Strong Sell | Bright red | Bright red
The pane background and decision table background use the same oscillator score ranges. The pane background is more transparent so the oscillator lines remain readable.
RSI Logic
RSI Level | Meaning
--- | ---
30 | Buy threshold
45 | Bear bias threshold
55 | Bull bias threshold
70 | Sell threshold
RSI contributes bullish score when it is above the bull bias level and bearish score when it is below the bear bias level.
An RSI cross above the buy level adds a smaller bullish timing point. An RSI cross below the sell level adds a smaller bearish timing point.
Stochastic Logic
Stochastic is bullish when %K is above %D and %K is above 50.
Stochastic is bearish when %K is below %D and %K is below 50.
Stochastic Event | Meaning
--- | ---
%K crosses above %D before the sell level | Bullish timing confirmation
%K crosses below %D after the buy level | Bearish timing confirmation
Stochastic crosses above the buy level | Bullish threshold confirmation
Stochastic crosses below the sell level | Bearish threshold confirmation
MACD Logic
MACD is bullish when the MACD line is above the signal line and the histogram is positive.
MACD is bearish when the MACD line is below the signal line and the histogram is negative.
A MACD line crossover above the signal line adds a bullish timing point. A cross below the signal line adds a bearish timing point.
MACD can be normalized for display so it fits in the same oscillator pane as RSI and Stochastic. The raw MACD values remain available in the Data Window.
EMA Trend Filter Logic
When enabled, the EMA trend filter checks the fast EMA, slow EMA, and long trend EMA.
Filter State | Condition
--- | ---
Bullish | Fast EMA above slow EMA and price above long trend EMA
Bearish | Fast EMA below slow EMA and price below long trend EMA
Disabled | Does not affect the score
Volume Logic
When enabled, volume confirmation compares current volume against average volume.
Volume State | Condition
--- | ---
Bullish confirmation | Above-average volume with a bullish candle
Bearish confirmation | Above-average volume with a bearish candle
No confirmation | Normal or low-volume candle
Disabled | Does not affect the score
Visual Output
The oscillator pane can show RSI, Stochastic %K, Stochastic %D, optional normalized MACD line and signal line, optional normalized MACD histogram, green or red background based on the decision score, Buy / Sell setup markers, and Strong BUY / SELL markers.
Green background means the oscillator score is bullish. Red background means the oscillator score is bearish. Stronger color appears when the score reaches strong buy or strong sell territory.
Decision Table Rows
Row | What It Shows | How To Read It
--- | --- | ---
Osc Decision | Final oscillator decision and oscillator score | Main timing summary. Strong Buy / Buy means momentum confirmations are bullish. Strong Sell / Sell means momentum confirmations are bearish. Neutral means timing is mixed.
Stoch K/D | Current Stochastic %K and %D relationship, plus both values | Bullish means %K is above %D and %K is above 50. Bearish means %K is below %D and %K is below 50. Mixed means the condition is not directional enough.
Stoch Signal | Whether Stochastic created a buy cross, sell cross, or no fresh cross | Buy Cross appears when %K crosses above %D or above the buy level. Sell Cross appears when %K crosses below %D or below the sell level. None means no fresh Stochastic cross is active.
RSI Signal | Whether RSI crossed the configured buy or sell threshold | Buy Cross appears when RSI crosses above the buy level. Sell Cross appears when RSI crosses below the sell level. None means no fresh RSI threshold cross is active.
MACD Cross | Whether MACD crossed its signal line, plus raw MACD and signal values | Bull Cross means MACD crossed above signal. Bear Cross means MACD crossed below signal. None means no fresh MACD crossover is active.
Setup | Trade-watch state produced by the oscillator score | Strong Buy and Strong Sell are the strongest timing states. Buy Watch and Sell Watch are earlier setup states. Wait means there is not enough directional agreement.
Use the table as a timing tool. It is strongest when the oscillator decision agrees with broader chart-level trend context.
Data Window Values
When enabled, the script exposes Decision Score, Decision Code, MACD Raw, MACD Signal Raw, and MACD Histogram Raw.
Code | Meaning
--- | ---
2 | Strong Buy
1 | Buy
0 | Neutral
-1 | Sell
-2 | Strong Sell
Alert Logic
The script includes alerts for Strong Buy Decision, Strong Sell Decision, Buy Setup, Sell Setup, RSI Buy Cross, RSI Sell Cross, Stochastic Buy Cross, Stochastic Sell Cross, MACD Bullish Cross, and MACD Bearish Cross.
Strong decision alerts come from the oscillator score entering strong buy or strong sell territory. Setup alerts come from the score entering watch-long or watch-short territory. Indicator cross alerts are based on their individual RSI, Stochastic, or MACD crossover conditions.
Reading The Output
This script is mainly a timing tool. Bullish output is strongest when RSI, Stochastic, MACD, trend filter, and volume all align. Bearish output is strongest when those same components align to the downside.
When used with the EMA MACD Decision Table script, the chart-level table gives broader trend context and this oscillator gives timing confirmation.
สคริปต์โอเพนซอร์ซ
ด้วยเจตนารมณ์หลักของ TradingView ผู้สร้างสคริปต์นี้ได้ทำให้เป็นโอเพนซอร์ส เพื่อให้เทรดเดอร์สามารถตรวจสอบและยืนยันฟังก์ชันการทำงานของมันได้ ขอชื่นชมผู้เขียน! แม้ว่าคุณจะใช้งานได้ฟรี แต่โปรดจำไว้ว่าการเผยแพร่โค้ดซ้ำจะต้องเป็นไปตาม กฎระเบียบการใช้งาน ของเรา

คำจำกัดสิทธิ์ความรับผิดชอบ
ข้อมูลและบทความไม่ได้มีวัตถุประสงค์เพื่อก่อให้เกิดกิจกรรมทางการเงิน, การลงทุน, การซื้อขาย, ข้อเสนอแนะ หรือคำแนะนำประเภทอื่น ๆ ที่ให้หรือรับรองโดย TradingView อ่านเพิ่มเติมใน ข้อกำหนดการใช้งาน
สคริปต์โอเพนซอร์ซ
ด้วยเจตนารมณ์หลักของ TradingView ผู้สร้างสคริปต์นี้ได้ทำให้เป็นโอเพนซอร์ส เพื่อให้เทรดเดอร์สามารถตรวจสอบและยืนยันฟังก์ชันการทำงานของมันได้ ขอชื่นชมผู้เขียน! แม้ว่าคุณจะใช้งานได้ฟรี แต่โปรดจำไว้ว่าการเผยแพร่โค้ดซ้ำจะต้องเป็นไปตาม กฎระเบียบการใช้งาน ของเรา
คำจำกัดสิทธิ์ความรับผิดชอบ
ข้อมูลและบทความไม่ได้มีวัตถุประสงค์เพื่อก่อให้เกิดกิจกรรมทางการเงิน, การลงทุน, การซื้อขาย, ข้อเสนอแนะ หรือคำแนะนำประเภทอื่น ๆ ที่ให้หรือรับรองโดย TradingView อ่านเพิ่มเติมใน ข้อกำหนดการใช้งาน